Hello All I trust you are keeping well and safe.
So here I am bringing you the 14th instalment of the EDNA challenge!
Its been a busy few weeks at Enterprise and the content and material being published to the forum, YouTube, analyst hub and more has just been epic.
Things are moving fast in the Power BI world, and we are seeing massive improvements to the product itself but also seeing significant investment into the supporting infrastructure and eco systems signalling exciting times for Power BI.
With all the rich updates and features it can sometimes become difficult to implement and practice the theoretical applications of such advancements to actual industry scenarios.
Up step the Enterprise DNA challenge.
The challenge was designed with a view that it would allow for us to bring to you great scenarios and data problems which would resonate with industry and allow you to focus in and practice and fine tune your skill set.
It would provide the perfect blend of implementing learnt knowledge while also challenging your understanding.
We at Enterprise DNA are massive of believers of getting your hands dirty and getting stuck into the problems head on.
We really want more of you to get stuck in to the challenges and as such are keen to hear any thoughts and ideas about how we can get more of you involved.
The challenges provide the perfect playground for you test, learn, share, and collaborate with some of the best minds in power bi.
It really is an experience like no other and the speed at which your learning will accelerate will be phenomenal. Be sure to go back over the previous challenges and have a look at some of the work being produced and how so many entrants have gone on to produce jaw dropping entries.
I know there are always a number of you sat on the fence debating whether to start or not quiet sure where to start I highly recommend the training from our expert Jarret where he takes you through producing one his challenge entries from start to finish a great way for you to learn and participate and follow along for this challenge.
As always there is a coveted Enterprise DNA membership on offer along side the opportunity for your work to be showcased across out social media platforms and used in showcases.
Winning Enterprise DNA member - Free Membership
Most innovative Entry - Free Membership (Open to both members and non-members and the overall winner can also claim the most innovative title)
Winning Non-Enterprise Member - Free Membership (Open to everyone)
First time participant winner- Pick from a selection of prizes as mentioned here. You must be an Enterprise DNA member to qualify.
The Brief
So the brief.
You are working as a data analyst for the ‘Foundational Trust of Medicine’ and have been tasked with helping to analyse the following dataset.
The foundational trust receive calls every second daily.
Patients ring 555 for medical emergencies requiring an ambulance responder.
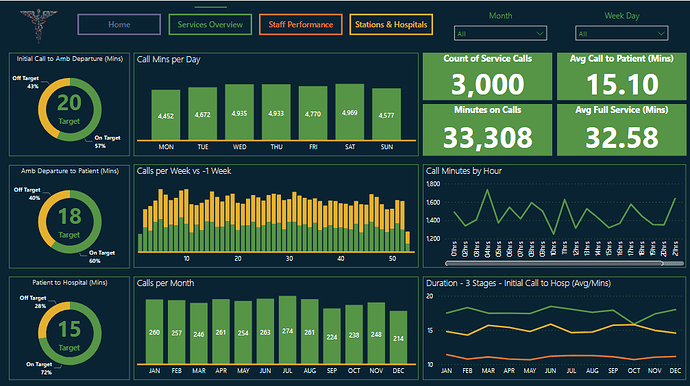
A years’ worth of data has been taken and the trust are trying to analyse the current process as well as understand how the service is currently operating and if there are any opportunities for improvement or causes for concern.
The process is currently outlined below:
A patient calls 555---->A member of staff will receive the call (Time Recorded) and assign a despatch code----->once the despatch code has been assigned---->The Ambulance will then leave the station (Time Recorded) -----> The Ambulance will then arrive at the patients house (Time Recorded) -----> The Ambulance will then arrive at the Hospital (Time Recorded)------> Then there is one final Timestamp for when the job is complete.
The data should be pretty self-explanatory and should be ripe for us to devour in Power BI. This is a completely random and anonymised data set for obvious reasons. However this shouldn’t detract from us going through the process of and really creating a compelling story and report within Power BI.
Food For Thought
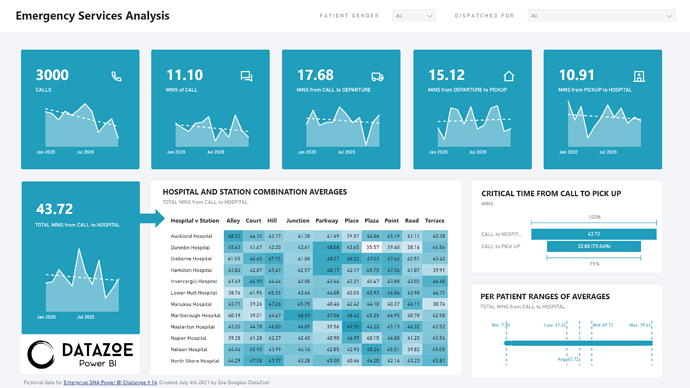
No of calls
Time between time of call and ambulance departure.
Time taken for ambulance to arrive to patient.
Time taken from patient house to hospital.
No of jobs between specific period i.e over lunch times 12:00-14:00
Does the despatch code affect the timings?
Does the call handler have any impact?
Do certain hospitals have issues in particular aspect
What does the data say based upon the ambulance station?
Does patient Sex affect handover times?
Challenge 14 Data.xlsx (426.4 KB)
Any questions issues clarifications do not hesitate to get in touch.
Conclusion
We really want encourage you all to get involved in some way shape or form so please do get involved even if its just sharing this with someone who might be interested.
SUBMISSION DUE DATE - Sunday, 11th July 2021 (PST)
Please can you all submit your PBIX files to powerbichallenge@enterprisedna.co
Best of luck!
Any issues or questions please reach out.
Thanks ![]()
Haroon
Enterprise DNA


 … I need to get my hand on this Numerro Toolkit.