Here’s Hossein’s entry for Power BI Challenge 14. @sedhosen, feel free to add other details of your work.
Here’s how Hossein described it:
Data Transformation:
- Protocol Name column in dimDispatchCode sheet needed to be trimmed
- The format of DateTimeofCall column in CallTiming sheet needed to be changed using “Using Locale …” option by right clicking on this column in query editor
- Adding an “Index” column to CallTimings table.
- Adding “Dates” & “Times” tables.
- Creating relationships between Date & Times tables and the fact table (CallTimings)
- Creating age category column showing the distribution of patients’ age
Insights
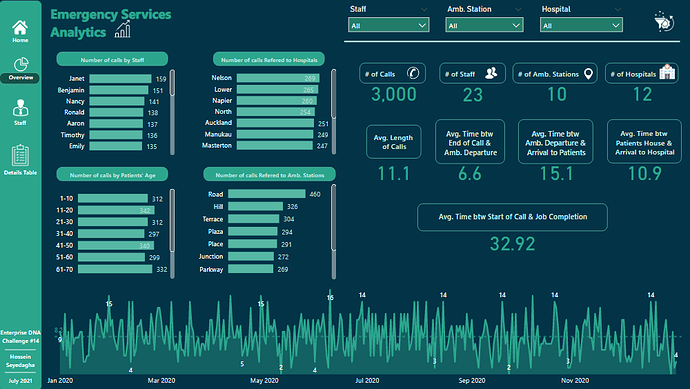
- The number of calls referred to “Road” station was significantly more than that of other stations.
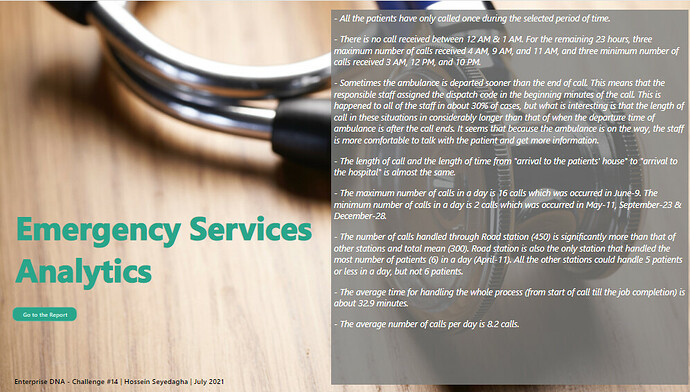
- Every patient has only called once during the report period of time.
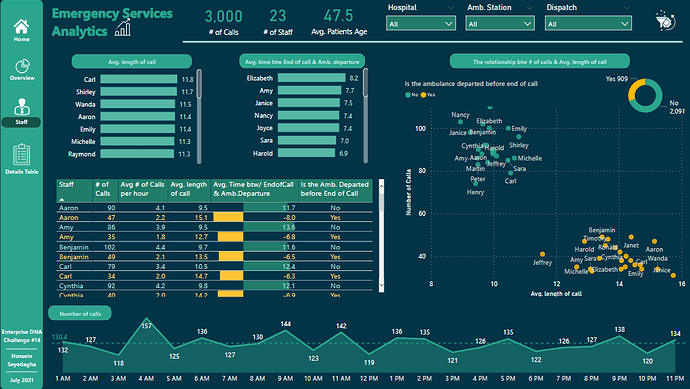
- There is no call received between 12 AM & 1 AM. For the remaining 23 hours, three maximum number of calls received 4 AM, 9 AM, and 11 AM, and three minimum number of calls received 3 AM, 12 PM, and 10 PM.
- The length of call and the length of time from “arrival to the patients’ house” to “arrival to the hospital” is almost the same.
- The maximum number of calls in a day is 16 calls which was occurred in June-9. The minimum number of calls in a day is 2 calls which was occurred in May-11, September-23 & December-28.
- The number of calls handled through Road station (450) is significantly more than that of other stations and total mean (300). Road station is also the only station that handled the greatest number of patients (6) in a day (April-11). All the other stations could handle 5 patients or less in a day, but not 6 patients.
- The average time for handling the whole process (from start of call till the job completion) is about 32.9 minutes.
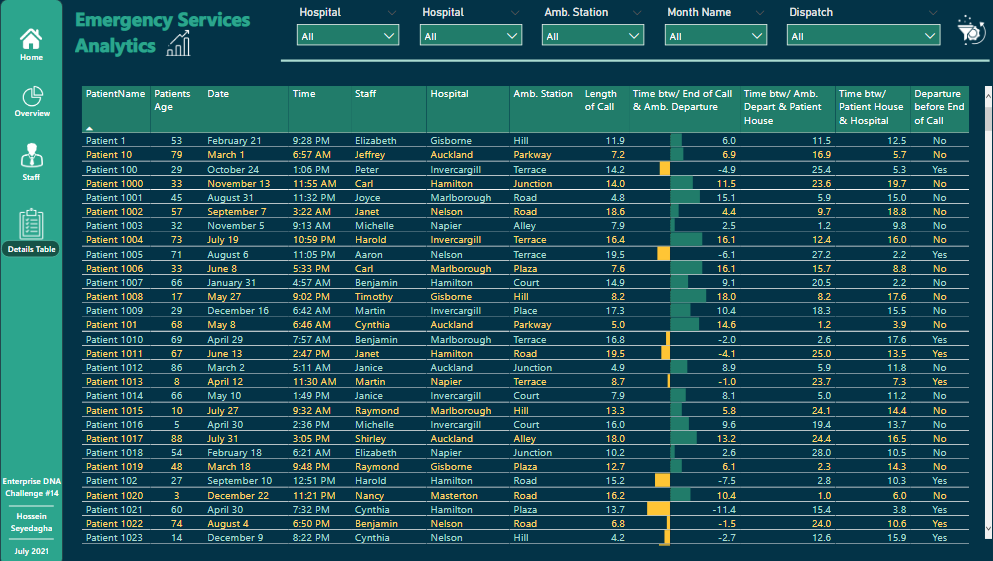
- When I was calculating the time between start of call and ambulance departure, I realized that it is more accurate if I can calculate the time between end of call and ambulance departure. Or the time between “start of call” and “ambulance arrival to patients’ house”. Working on the time spans between steps, I found there were some situations (about 30% for all staff) in which the staff assigned the dispatch code and sent the ambulance before their conversation with the patients was over. In these cases, the average time between “start of call” and “ambulance arrival time to the patients’ house” is 22.4 minutes which is 14.4 minutes (40%) lower than that of when the staff assigns the dispatch code after the call ends (36.8 minutes). It is a significant difference that definitely catches the manager’s attention and helps them for their future decisions.
On the other hand, I also found that there is a strong relationship between the “length of call” and the “departure of ambulance” before or after the call ends. The duration of conversation in these cases (14 minutes) is about 4 minutes more than that of other cases (10 minutes). These facts, all together shows that in these cases not only the ambulance could get arrived to the patients’ house sooner, but also the staff had enough time (were NOT in a hurry) to get thorough information from the patients’ situation and convey it to the ambulance staff.
To learn about the real-life scenario presented for the challenge, be sure to click on the image below.


