Here’s Tim’s entry for Power BI Challenge 14. @tweinzapfel, would you like to share how you built this dashboard and what your inspiration is in building it?

Here’s the link to the report:
And here’s how Tim described it:
With every challenge, I usually set a couple of goals/new skills to accomplish. For this one:
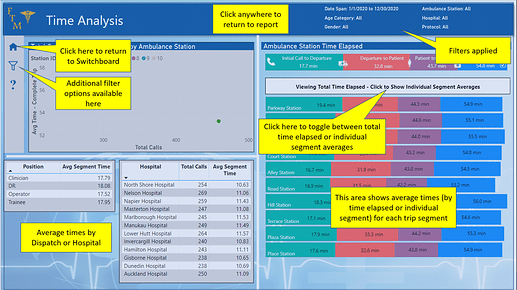
- I wanted to create a visual using the “Charticulator” custom visual. This is by far my favorite custom visual yet requires some learning curve. So this was a great opportunity to use this. [Visuals are on 3rd picture below; chart on right side - there are actually 3 in total although two are toggled between bookmarks]
(@sam.mckay - perhaps a training series on Charticulator?)- Given the time data – I wanted to use the “Timeline by Queryon” custom visual (credit to Brian Julius for showing this previously)
Also - with most of my visuals now going forward, I always try and add a help/information view that Guy in a Cube showed a while back (example in last picture below). And - with every report that I do - some tooltips added in here and there.
Technical details
ETL Notes
- Added an index column in Power Query
- Added a category of patient ages categorize them based on age ranges
- For the protocol table – added a shorted one for visualization purposes.
- A duplicate fact table created to track call segments. This was used for the “Timeline by Queryon” custom visual
Report Features
Overall:
• Slicer panel on every page; Panel appears/disappears to save space. All slicers are synced across the pages; Filters applied are shown on the top right of each page
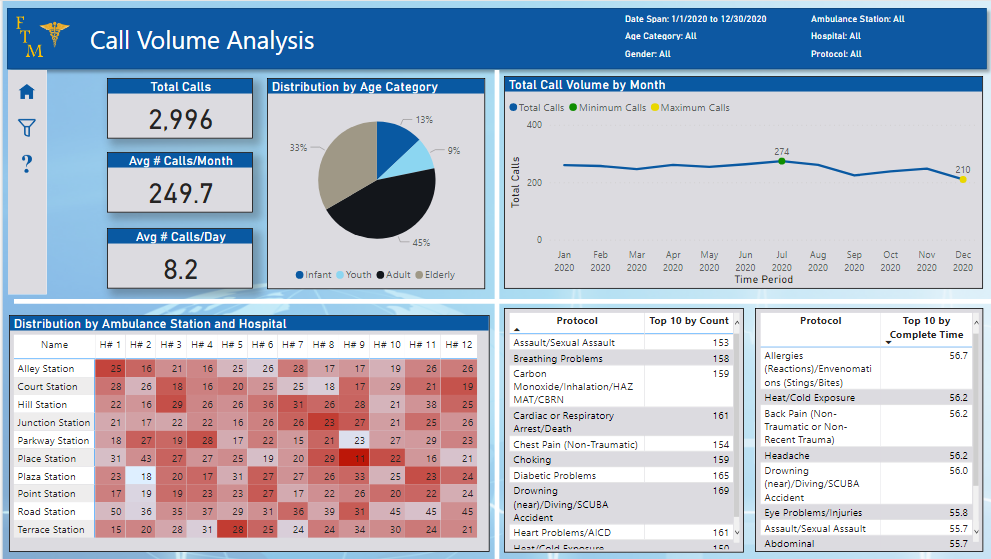
• Each page has an information sheet. On the left side navigation bar, there is a question mark that will toggle this (credit for this technique goes to Guy in a Cube)Volume Analysis:
• Call Volume by month will show min and max amounts (technique was one from a WoW challenge - http://www.workout-wednesday.com/power-bi-challenges/ )
• Ambulance/Hospital matrix has tooltips to provide more detailed informationTime Analysis:
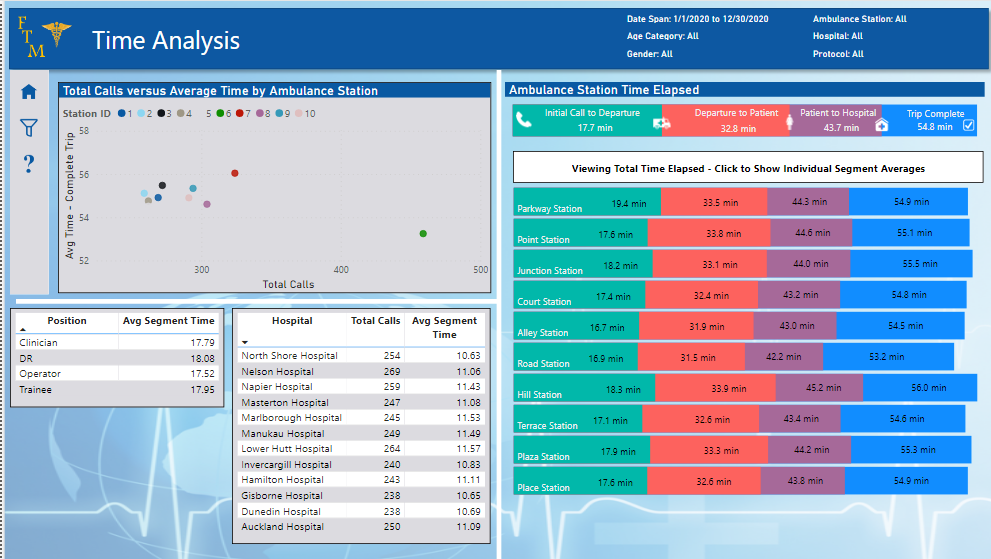
• “Charticulator” used to show averages by each segment (right side visual); there are 3 different visuals here with the top one being an overall average and then a section below to show breakdown by station. There are buttons to toggle between total time elapsed versus the individual segment averages for this lower section.Patient Page:
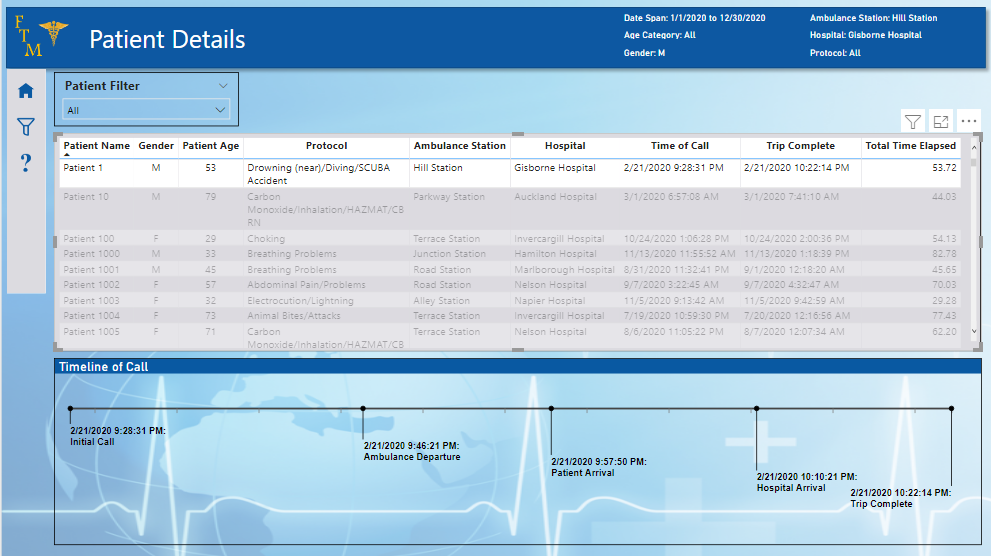
• “Timelime by Queryon” used to display timeline of call. This only works well if one patient is selected. Thus a message is displayed when not. Technique for this credited to Excelerator BI (https://exceleratorbi.com.au/show-or-hide-a-power-bi-visual-based-on-selection/)Additional credits
- Power BI Tips Youtube Channel for great videos on Charticulator https://www.youtube.com/channel/UCPwPrIpZwlfIKcoUpRwl9OQ
- https://www.iconsdb.com/white-icons/ for all the icons in the report.
To learn about the real-life scenario presented for the challenge, be sure to click on the image below.
