Here’s the entry from one of our non-member participants, Gustaw.


Here’s the link to the report:
And here’s how Gustaw described it:
Power BI Challenge 14th – Emergency services analytics
Below I introduce some additional explanation related with applied logic, dax measures, visualization and other components of the report. There’re dozens of questions that could be covered, however I’m going to focus only on the most significant ones.
Data Visualization / layout
Basic template (dark backgrounds) is made in Microsoft PPT.
Most of borders, that separate one visualization from another are made by adding shapes (thin rectangles) in Power BI desktop. From my current perspective it’s far more effective and far easier way to create spaces between visualizations comparing to make „pre-planned” boarders in PPT.
There are additional backgrounds applied on each visual to prevent effect of „invisible” labels when turning the focus mode on.
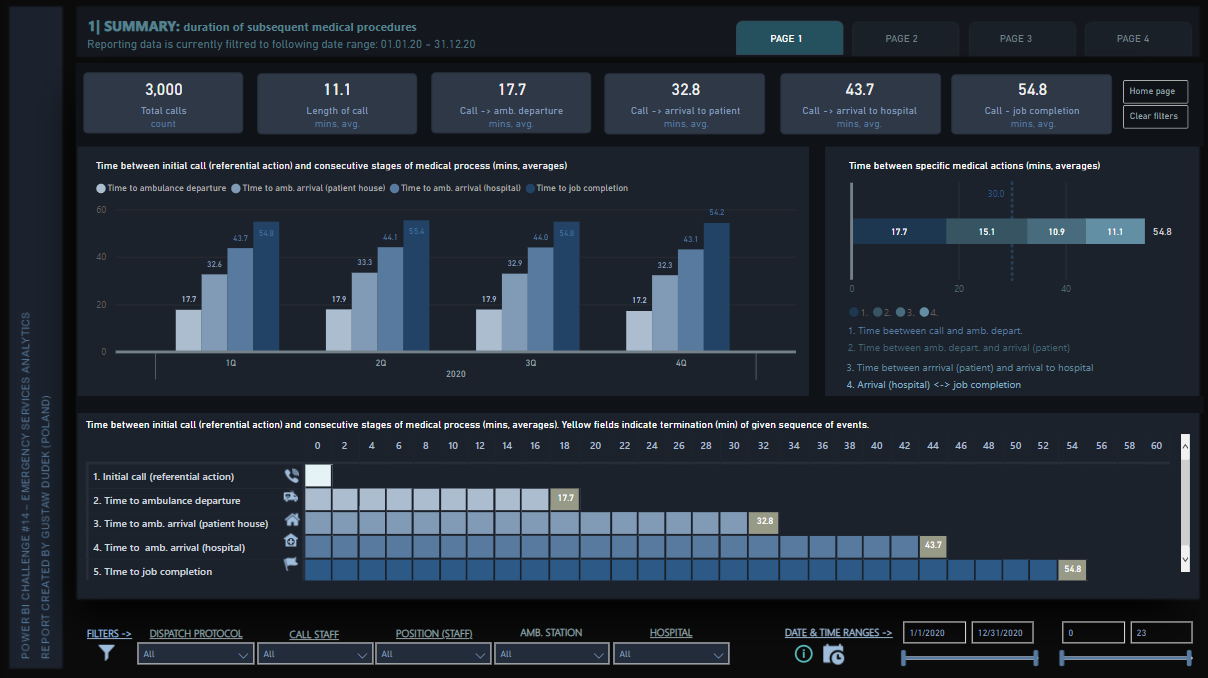
Most of „non time-line type of visualizations” are created using various style of conditional formatting. Considerating similar data sample across different categories / dimensions it allows to ephasise potential differenties in particular metrics / timings.
Navigation / additional panes and features
There are four main pillars of analysis in the following report. It’s possible to get acces to each of one by selecting particular field on „home page” or by selecting different buttons located in the right upper corner of the dashboard.
There are additional buttons (in the right upper corner) that allow to back home page or to clean / erease all the applied filters (back to deafult mode) if needed.
There are additional information that pops out when hovering over specific field (e.g. hyperlink shows up when hoovering footer on home page or additional explenation shows up when hoovering „information icon” that stands near the calendar icon).
There is drill-through function applied on each report page that allows to check „calls register” within filtered context. Special button is added to easily back to origin analysis.
There is additional information just below the title of each page, that informs user what date range is currently selected.
Most basic filters are put on the bottom of the report. It applies to both medical database filters (such as name of particular dispatch protocol or ambulance station) and date & time ranges.
Other meaning slicers are added near the specific visualization. In most cases those slicers allow to select specific metrics, change date perspective or turn on/off some measures.
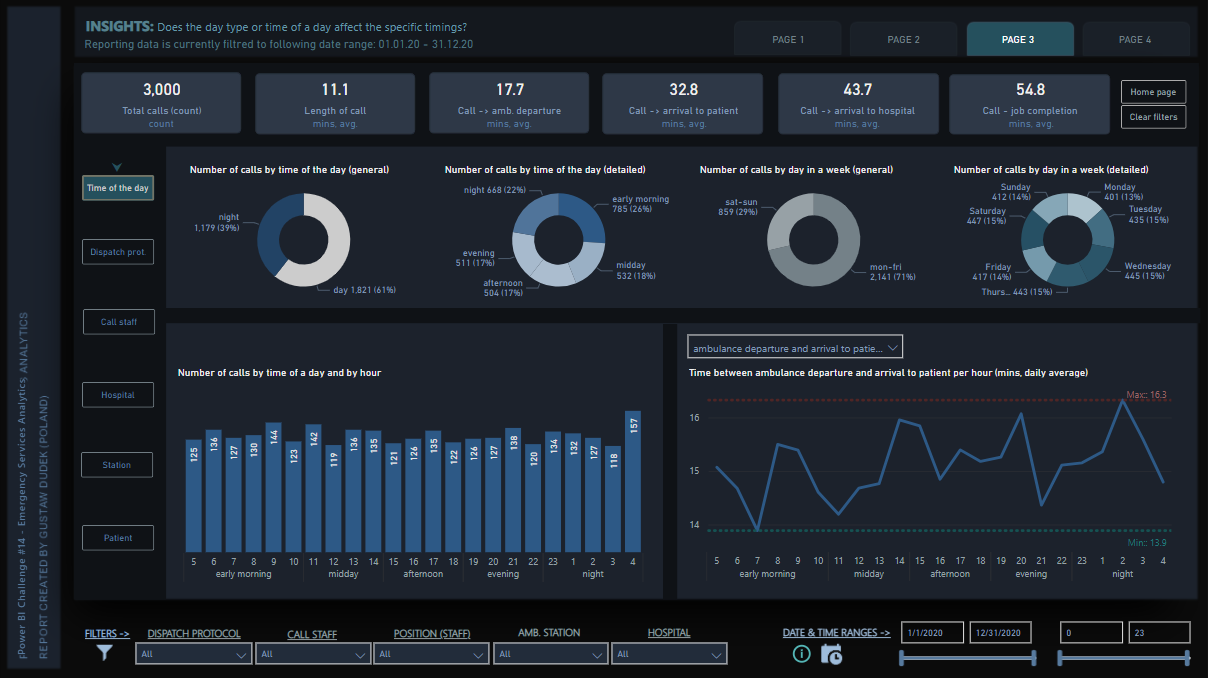
There is additional navigation pane on page 3 („Insights”) that allows user to jump between various analytical insights.
Data modeling and dax measures:
Most tables derive fromt original DNA Enterprise database. A few additional tables are added to the model to address additional analytical needs.
Most columns that contain information about duration (mins) betwen different steps / stages of emergency procedures are calculated using PQ.
Most metrics (row counts, averages, moving averages) are calculated via measures.
When facing a choice between using averages or medians as the paramount metric I choose averages. Median values are applied only to some specific visualization as a line (via additional analytical tools).
There are some „distinctive” measures applied in the report, such as:
- Measure that concatenates start date and end date within filtered context
- Measure that shows values in matrix (page 1: summary) only for the last point and hide all the other values.
- Measure that allows to select specific number of days in term of showing moving averages
- Measure that allows to show or hide specific measures on line chart
- Measure that allows to select one specific measure to analyze
- Metric that allows to marked all dates (months) when timings are either below or above average (page 3: Insights, hospital, small multiples).
To learn about the real-life scenario presented for the challenge, be sure to click on the image below.
