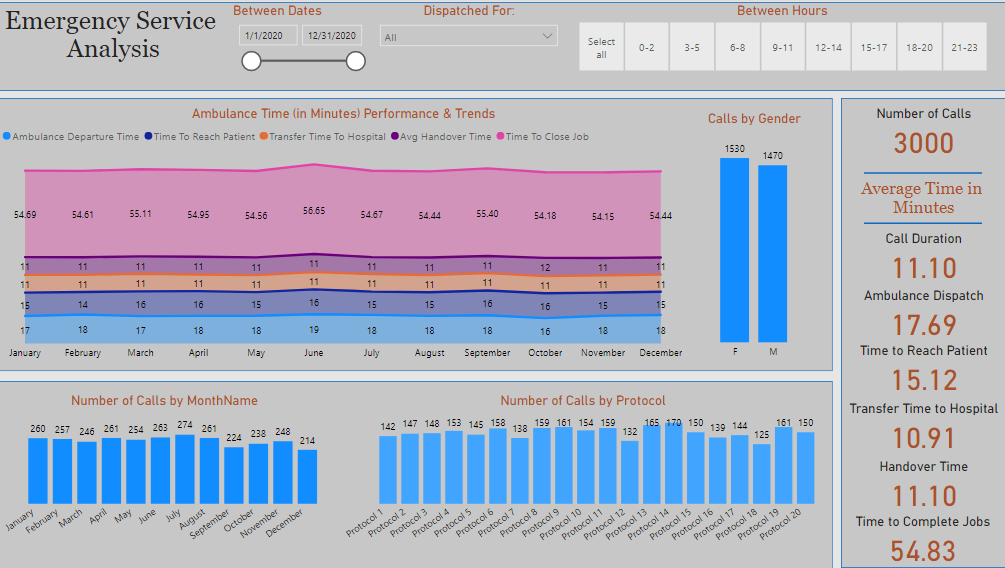
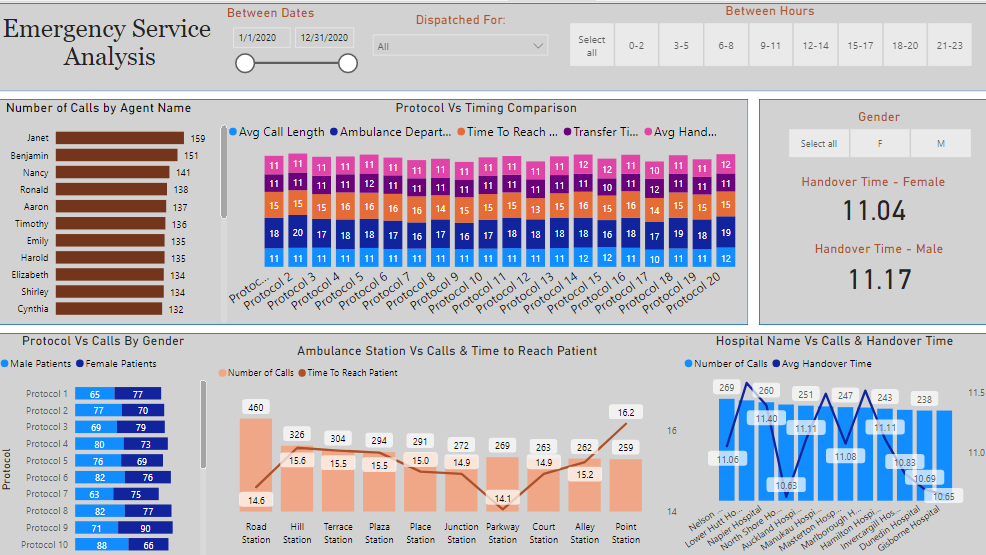
Here’s Japjeet’s entry for Power BI Challenge 14. @jps, would you like to share how you built this dashboard and what your inspiration is in building it?
To learn about the real-life scenario presented for the challenge, be sure to click on the image below.

This post is part of the Enterprise DNA platform improvements. Through these posts, members and non-members can showcase the resources and inspirations on how they come up with their challenge submissions. We hope all members can utilize it efficiently.
Thanks for getting involved in the challenge an well done on your submission. Is definitely a few improvements here but I know your only just getting started so it’s good to just kick things off and start to get a good feel for what you can do with Power BI which I can see that you have done.
I definitely think that you could choose some better visualizations for some of your insights. So maybe have a look at other reports that have one challenges or have been highly commended by others in past projects and just have a look at how they’ve used visualizations sometimes in a more simpler way but also just in a more condensed way. You can just use simple tables you can also use conditional formatting. You can sometimes also use tooltips. So it’s understanding all the variations and just picking and choosing what works best with which insight.
I think also making sure you use colors that are of a consistent theme. Try to stay away from the out of the box colors that Microsoft provides because they just don’t work well together. You can see from a lot of the great submissions of past that very simple color variations are used but the main thing is they are consistent across every single visual and report page.
Nice work and look forward to seeing more from you in the future.
Sam
1 Like