Hello All, I trust you are well and keeping safe.
It’s been a manic start to the new year with more lockdowns and restrictions being placed on many of us.
Last year we made some amazing strides with the Enterprise DNA Challenge and want to continue that momentum into this year.
We have some fantastic ideas and challenges lined up for the community and really cant wait to get going.
As always if you have any suggestions or comments, we are always happy to listen. Please feel free to reach out to myself or the Enterprise DNA team.
Check out the post below to learn about the challenge.
First time participant winner
Really simple, its open to all Enterprise DNA members. All you must do is let us know it’s your first challenge.
There is some amazing loot on offer not to mention the learning opportunity and free membership on offer.
We really want to see more of you get involved so even if it’s a post to the forum to join the conversation please do get involved.
To learn more about the challenge and how it works be sure to check out the forum below!
If you’re not sure of anything just reach out to me.
Remember: The weekly winner will receive a complimentary membership to the platform that they can share with anyone and the opportunity for your work to be showcased across our channels.
The Brief
Right lets get to it!
So as you’re all aware there is currently a little something known as CV19 that is changing the face of the world as we know it.
Businesses and livelihoods are trying to cope as best as they can, so what is the current status of CV19 across the globe and for any selected country? Is it getting better, worse, do we need to take some action?
Well now hopefully you as an analyst can help!
There are some amazing resources available online covering the CV19 pandemic and none better than the John Hopkins University (JHU) reporting which is used across the globe to report cases, deaths, and recoveries. News outlets and business across the globe use the JHU data for their reporting.
See the link below to see the dashboard produced by the JHU team.
A pretty awesome dashboard?
They haven’t only produced a great dashboard they have also made the data that sits behind it openly available.
So we are going to now use this data and create our very own dashboard in Power BI.
The key objectives are:
Connect to open-source data
Import and create a data model
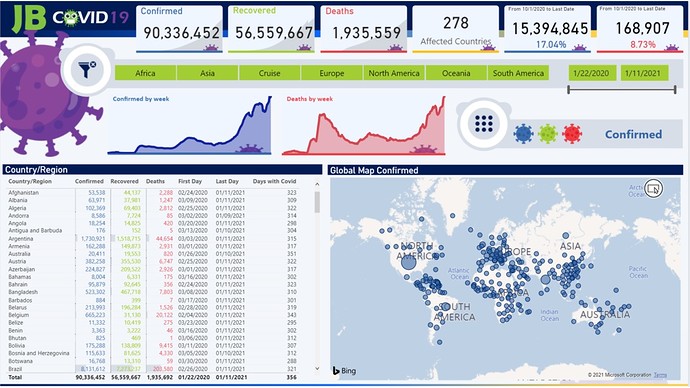
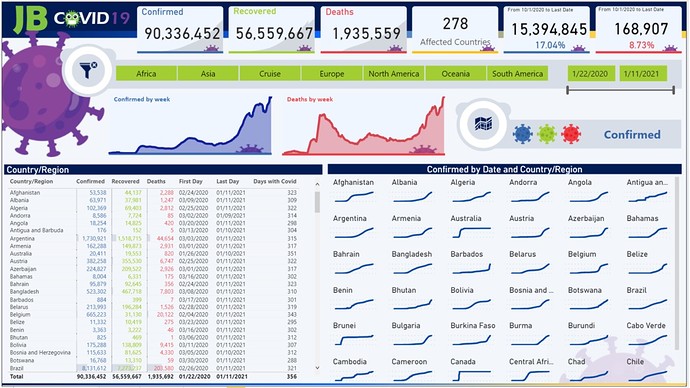
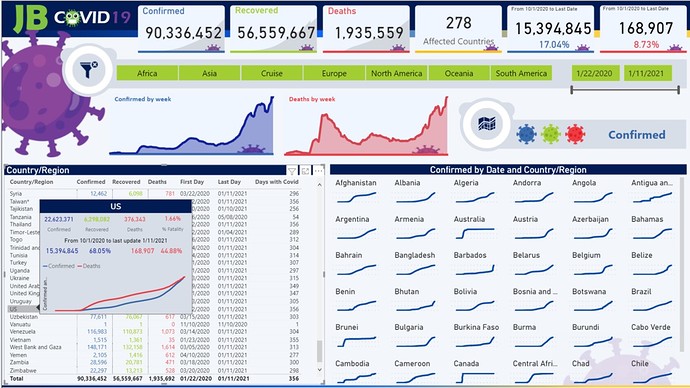
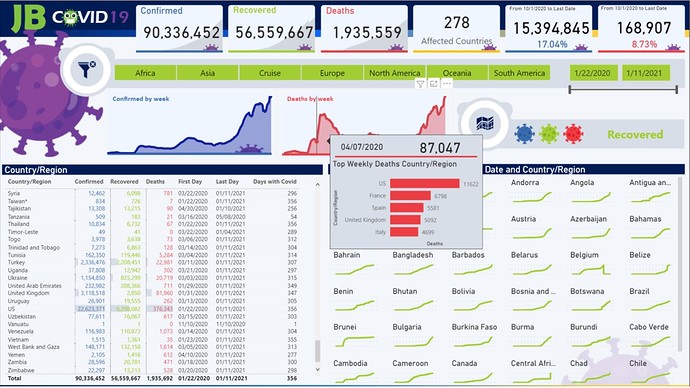
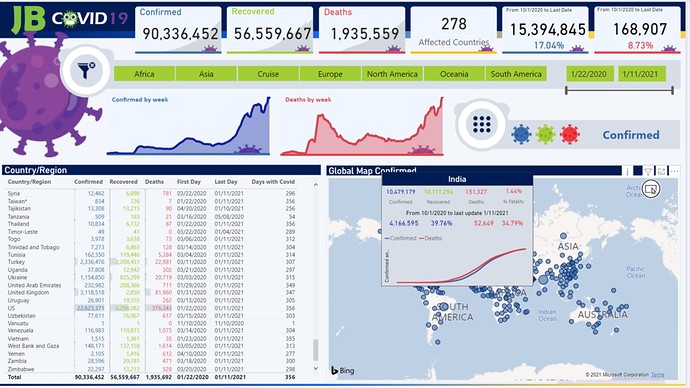
Create a 1 page report of what the current situation is.
The JHU team have made the data available in GitHub and we are interested in the time series data available at the following link.
Within this data set there are three key files that we are interested in pulling in for our analysis. The files we are interested in are listed below. I have also placed the URL of the required CSV.
The ask is that you pull this data in and build 1 page report covering what you believe to be the key statistics.
We are not looking for pages and pages of analysis think summary, C-level reporting a 1 page snapshot which lets us know what’s happening.
I have created a PBIX file where I have pulled this data in so nobody is starting from a blank canvas or completely lost. (wink, wink the Dimcountry dimension could require some further work and tidying).
Challenge 11 w ISO.pbix (872.2 KB)
I also did my first video for the challenges and went through how to pull the data in so be sure to check it out if you’re stuck. NOTE: In my video I did a merge which under the pressure of creating a video I got wrong I have since corrected it in the PBIX (Sorry).
Power BI Challenge 11 Announcement
Right over to you guys, I hope I have been clear in the ask if not please do not hesitate to get in touch.
SUBMISSION DUE DATE - Tuesday, 26th January 2021 (PST)
Please can you all submit your PBIX files to powerbichallenge@enterprisedna.co
Best of luck!
Any issues or questions please reach out.
Haroon
Enterprise DNA
