Here’s Abdelkader’s entry for Power BI Challenge 11. @gharbi-abdelkader , would you like to share how you built this dashboard and what your inspiration is in building it?
yes, I started realizing the challenge after finishing course “Power BI Super Users Workshop”, so I just follow the principals 4 pilar to realize my report.
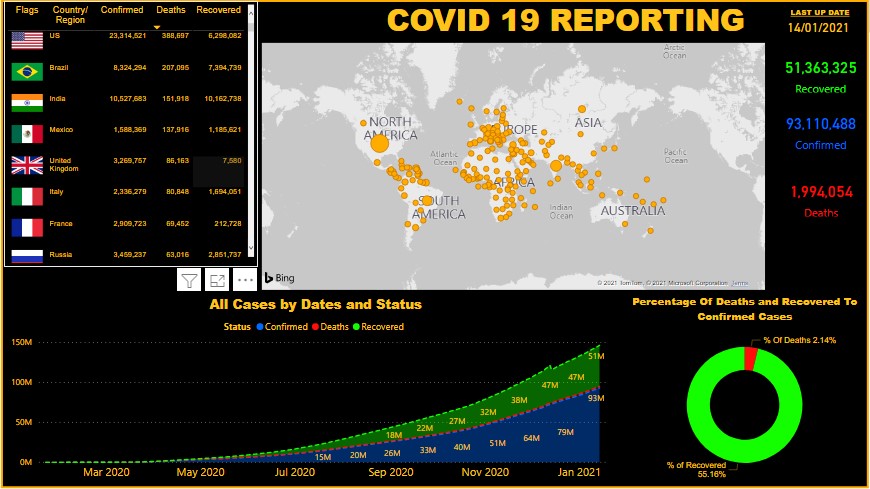
I kept the black background because the report is about a disease
I added links for flags of countries for easy search of cases
the hard part for me was the measures because the data was aggregated for every day but I figure out how to calculated them
by using the function CALCULTE and the time intelligence function DATEADD to catch the values of previous day
I want to thanks sir Sam and his team for the great materials available in enterprisedna for learning power bi
Good effort on this one. Like how you have used the flags especially. I think that I haven’t seen others use that extensively so well done. Now, I think maybe having a look at your colour themes would be a simple improvement.
Also maybe differentiating a little bit between the grids in your report would make the insights stand out a bit more.
I see that you haven’t used titles in consistent locations. I think you want to either centre the main title or put it on the far left in most cases.
Just some simple things I think would tidy this up and definitely utilise inspiration from other submissions throughout all our challenges. I think you’ll find some fantastic creativity that you can leverage off.