Here’s Amdi’s entry for Power BI Challenge 11. @Amdi, would you like to share how you built this dashboard and what your inspiration is in building it?
Here’s the link to the report:
To learn about the real-life scenario presented for the challenge, be sure to click on the image below.

This post is part of the Enterprise DNA platform improvements. Through these posts, members and non-members can showcase the resources and inspirations on how they come up with their challenge submissions. We hope all members can utilize it efficiently.
Nice one Amdi.
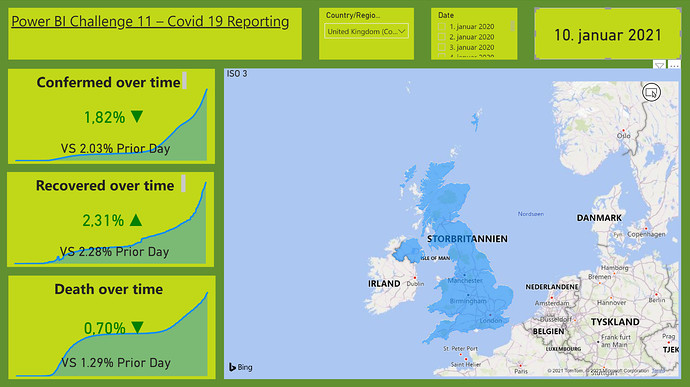
A simple and effective report that tells a decent story. I like how you have used the visualisations on the left to showcase a trend but then drill down into the numbers. The combination works well.
Potentially some additional analysis that could have been done. So maybe thinking outside the box next time round to deliver some analytics that might not be so obvious could add a little bit more value to the consumer experience.
But as always loved the participation and appreciate your contributions to the community.
Thanks
Sam