Here’s Jose’s entry for Power BI Challenge 11. @jbressan, would you like to share how you built this dashboard and what your inspiration is in building it?
Here’s the link to the report:
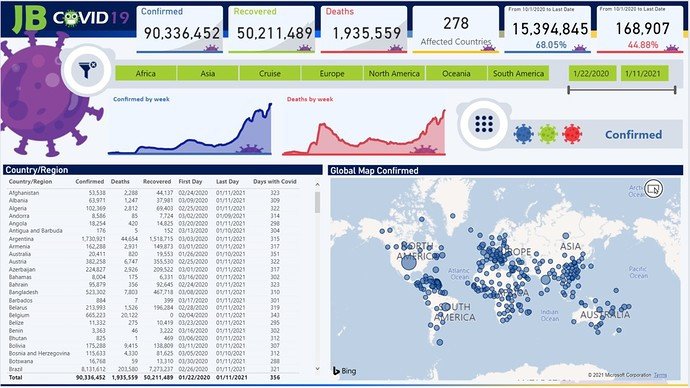
To learn about the real-life scenario presented for the challenge, be sure to click on the image below.

1 Like
This post is part of the Enterprise DNA platform improvements. Through these posts, members and non-members can showcase the resources and inspirations on how they come up with their challenge submissions. We hope all members can utilize it efficiently.
Fantastic submission to the challenge.
I love how you’ve gone out there with the report design and navigation. The little features here that you’ve added bringing a lot more value to the consumption experience. Even some of the small logos you’ve used to represent certain aspects of the data have been really well done.
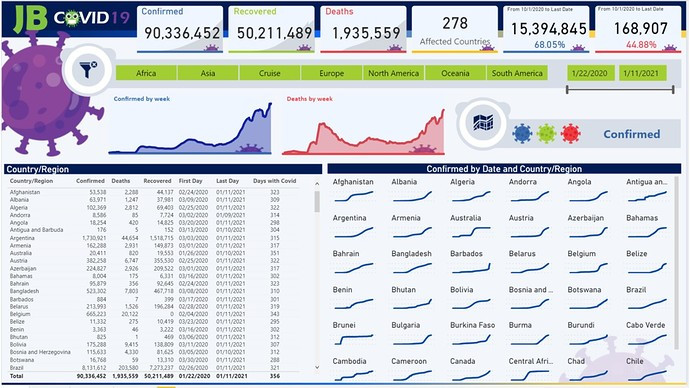
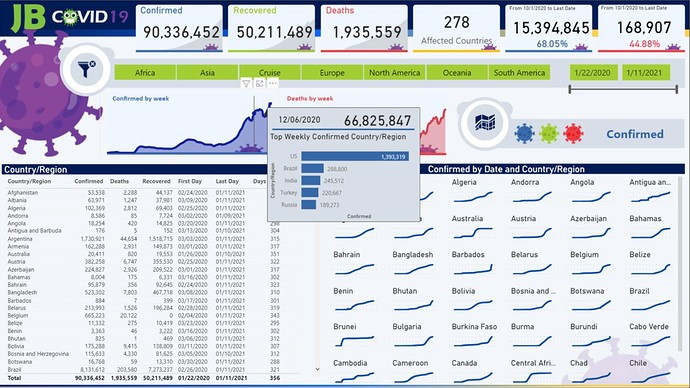
I also like how you’re broken out the visualizations in different ways and also added tooltips on top of them. All in all this is a really impressive submission and I think you’re showcased some real talent here.
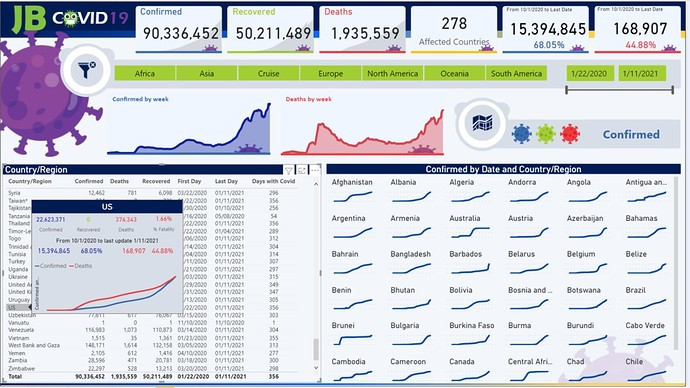
I know that some of those tooltip designs are quite intricate, and you executed on them successfully in the right locations and also made them super relevant as a consumer works across the report.
Super impressed by this.
Nice one
Sam
1 Like