Here’s Akila’s entry for Power BI Challenge 11. @akila789, would you like to share how you built this dashboard and what your inspiration is in building it?
To learn about the real-life scenario presented for the challenge, be sure to click on the image below.

This post is part of the Enterprise DNA platform improvements. Through these posts, members and non-members can showcase the resources and inspirations on how they come up with their challenge submissions. We hope all members can utilize it efficiently.
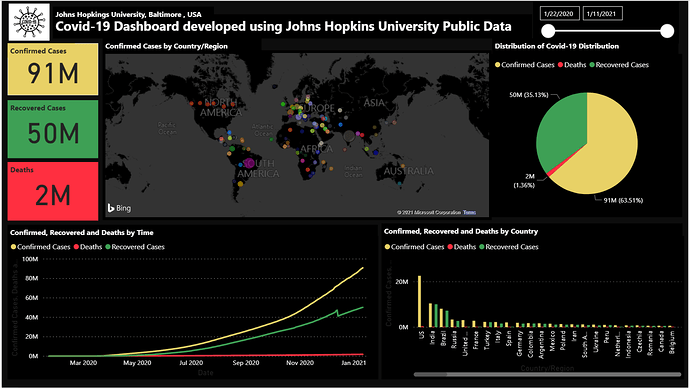
Nice efforts on this reports submission and development work. On this report how you’ve used clear and consistent titles and you’ve put them around the report page in specific grids. I think it all works and well together and highlights where the consumer should be navigating as they work through the data what’s your presented.
Also I like how your chosen the dark colouring to the map and I think that works really well. I think the randomness of the colour points on the map though detract a little bit from the well represented information. Something to consider.
Overall though I think that this tells the story that the consumer wants to know and gives them the ability to dive into any aspect of the analysis that they might want to. So nice work on bringing this altogether
Sam
1 Like
Thanks @sam.mckay for your feedback. It means a lot for me.