Hello to all my fellow Power BI enthusiasts.
I trust you are all keeping well and safe.
I know that our American contingent will be eagerly awaiting the results of the election while I sit here contemplating another lockdown in the UK starting tomorrow ![]() .
.
Fear not though, the Enterprise DNA challenge is here for its 9th instalment!
The last challenge was seriously amazing and there was some incredible value provided by all participants a massive well done again.
I’m going to keep banging on about this, but YOU NEED TO GET INVOLVED.
These challenges are created to help you and accelerate your learning with the help of the #BestPowerBICommunityByFar
First time participant winner
We are always looking to improve the challenges and get more of you involved and that’s why this week I want to bring to you an exciting new category courtesy of our very own @BrianJ.
Brian has kindly been sponsoring the newcomer prize however we felt that the uptake from the community wasn’t as we had envisaged.
We are therefor changing it up and giving even more of you an opportunity to get involved and bag yourself some goodies along with the recognition of being a challenge winner. The prizes on offer are as follows.
- A copy of the Definitive Guide to DAX, 2nd Edition (the indispensable "bible"of DAX) or your choice of any other book from the eDNA Forum Recommended List ; or
- A copy of SnagIt 2020 , a do-it-all screen capture and graphics tool used by the members of the expert team for screen grabs, annotation, gif and video generation, photo editing, etc. @nick_m got me hooked on this, and it has a million and one uses for Power BI report development; or
- A four-month subscription to FlatIcon.com - this is an online service with millions of downloadable and editable icons that you can use to really polish your Power BI reports.
Really simple, its open to everyone and anyone no matter what your background or experience, however you must be a member of Enterprise DNA an intern or part of the scholarship programme.
All you must do is let us know it’s your first challenge.
There is some amazing loot on offer not to mention the learning opportunity and free membership on offer.
We really want to see more of you get involved so even if it’s a post to the forum to join the conversation please do get involved.
To learn more about the challenge and how it works be sure to check out the forum below!
If you’re not sure of anything just reach out to me.
Remember: The weekly winner will receive a complimentary membership to the platform that they can share with anyone and the opportunity for your work to be showcased across our channels.
THE BRIEF
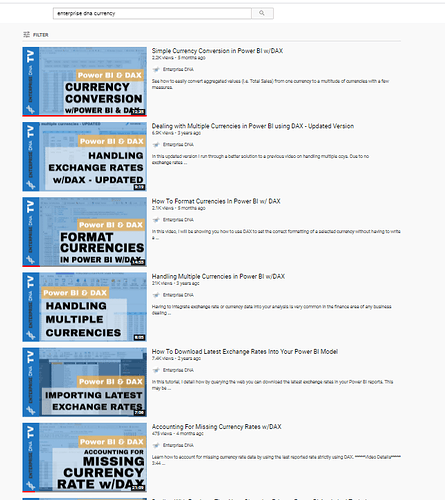
As I was reviewing some posts on the forum, I came across some absolute super content around currency conversion. There are some seriously amazing forum posts and videos available covering this technique.
This gave me a super idea for challenge 9.
So I had to dig up the archives and unearth a dataset that would not only allow you to review and implement the techniques but hopefully challenge you to ensure that you can apply the techniques regardless of the data set.
This is an actual dataset where sensitive details have been masked but there have been no further transformations carried out.
Requirements
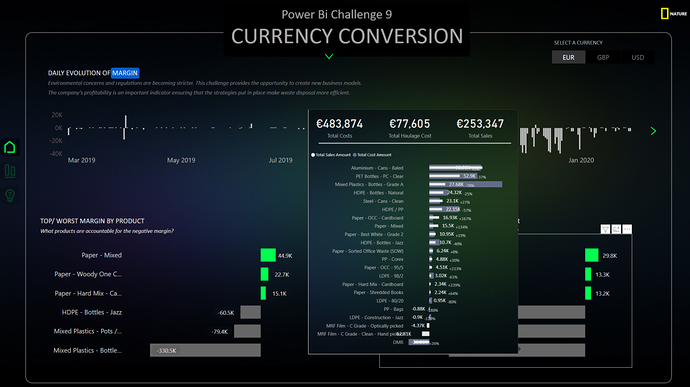
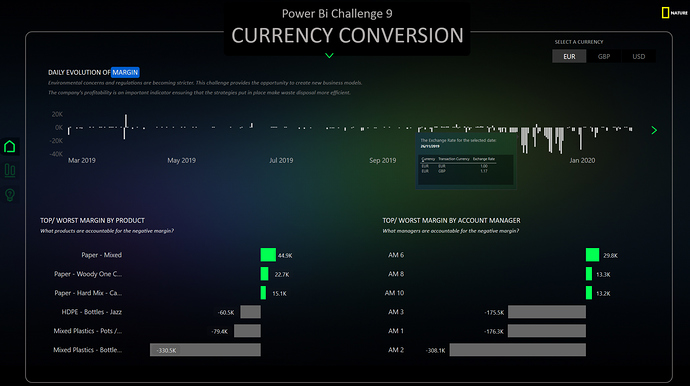
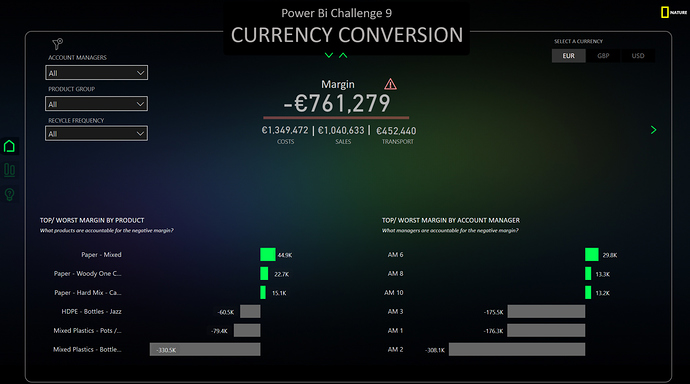
The ask is to produce a report from the data above that gives the user the ability to select a currency and see the associated sales and cost.
The user wants the ability to know the conversion rate that has been used. This can be an average value.
Highlight any issues with the data.
Points to note
If there is data missing bring this to the users’ attention as we may not be aware of these issues.
Sales and cost values can be negative as the data is related to waste management.
Est weight -is the number of units that the business are buying. If there is a value in either Total Supplier Weight or Total Buyer Weight use that but alternatively take the Est Weight
While the data set is small there is a lot going on that will need distilling. So pay attention.
UPDATE
After some conversations and suggestions from the community I want to provide some further context to help you understand requirement.
The Business
The data has been taken from Enterprise DNA Recycle LTD (EDR).
EDR are a company who look to buy and help remove scrap and waste recyclables from clients and then sell these to other providers.
For certain items they incur a cost and for others they are actually paid to take away the materials. This is why there is negative values associated with the cost.
This is also true for the sales they make. Some materials are received by buyers who they pay to take the materials away.
To complicate matters further ERD work with clients around the globe and are therefore purchasing, selling and hauling in different currencies.
There is a very manual and onerous process to consolidate costs sales and profitability.
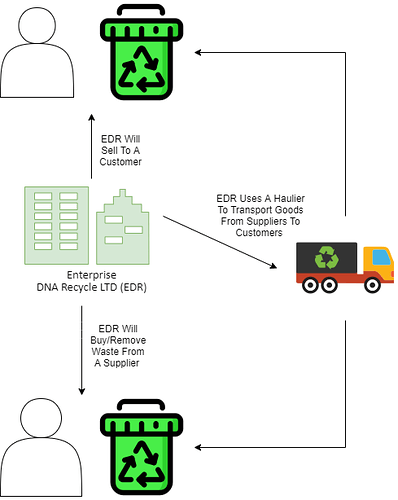
Below is a diagram of how the business works.
Breaking down the problem
As mentioned above that the business operates in a number of countries and therefore receive multiple currencies.
There is a lot of detail in the dataset however we can distil the key information as follows.
Ignoring all dimensionality to begin with the key columns are as follows.
Ref
Unit Purchase Price
Purchase Currency
Unit Sales Price
Sale Currency
Haulage Cost
Haulage Currency
Est Weight
Total Supplier Weight
Total Buyer Weight
Below is the top 10 rows extracted from the dataset for just the fields above.

REF 002 Example broken down:
Unit Purchase Price: £930
Unit Sale Price: €880
Haulage Cost: £450
Est Weight: 20
Calculation
Total Cost Amount = 20(Est Weight) * £930 (Unit Purchase Price) = £18600
Total Sales Amount = 20(Est Weight) * €880(Unit Sale Price) = €17600
Haulage Cost = £450
Now with the given data its hard to work out profitability as we have multiple currencies involved simply doing total costs and sales isn’t going to work.
Therefore what the business have is an exchange rates table and convert something along the lines of:
| Euro | 1 | US Dollar | 1.18 |
|---|---|---|---|
| Euro | 1 | British Pound | 0.9 |
| British Pound | 1 | US Dollar | 1.32 |
| British Pound | 1 | Euro | 1.11 |
| US Dollar | 1 | Euro | 0.85 |
| US Dollar | 1 | British Pound | 0.77 |
They want to report the figures in all three currencies.
£-Calculation
Total Cost Amount= £18600 -No conversion required
Total Sales Amount= £15840 (17600 *0.9 (exchange rate from table above)=15840)
Haulage Cost=£450 -No conversion required
Profits= -£3210 - Sales(£15840)-Costs(£18600+450)
€-Calculation
Total Cost Amount= € 20646 – (£18600*1.11(exchange rate from table above) =20646)
Total Sales Amount=€17600 - No conversion required
Haulage Cost=€499.50 (£450*1.11(exchange rate from table above) =499.50)
Profits= €-3545.5 Sales(€17600)-Costs(€20646 +€499.50)
$-Calculation
Total Cost Amount=$ 24552 -( £18600 * 1.32(exchange rate from table above) =24552
Total Sales Amount= $ 20768 – (17600*1.18(exchange rate from table above)=20768
Haulage Cost=$594 -( £450 * 1.32(exchange rate from table above)
Profits=$-4378 Sales(20768)-Costs(24552+594)
This then allows them to report in any currency dependant on the use case.
Data Model
The company are looking to leverage Power BI to help remove the manual effort of converting.
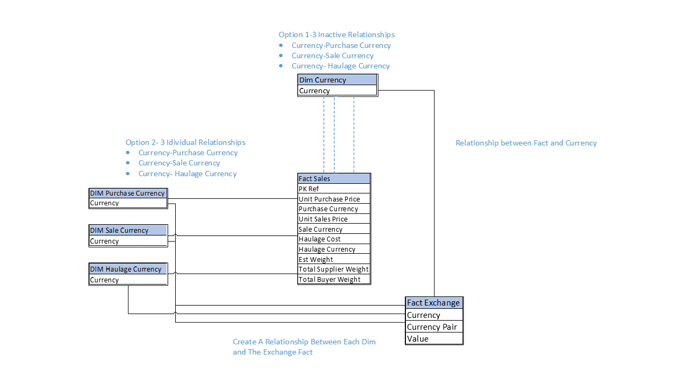
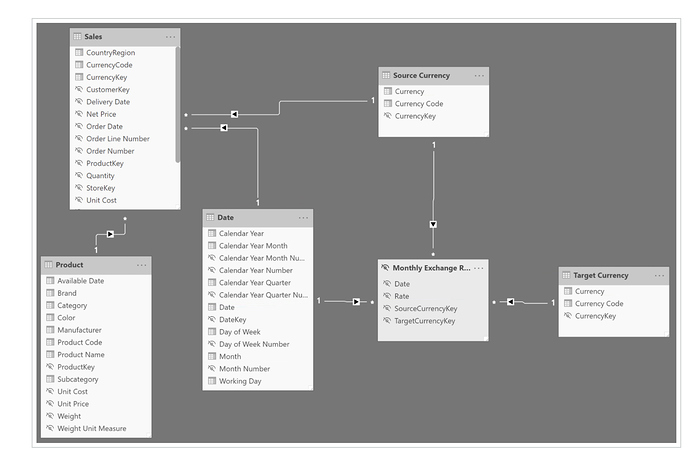
Ultimately the design of the model is up to you and I really don’t want to be to prescriptive or limit anyone’s thinking. So below I have shared a very high-level design to help facilitate your modelling efforts.
I have ignored the other dimensions for now but this is something you could easily add to enrich the data and reporting.
If any of you would like any further support please do not hesitate to get in touch.
SUBMISSION DUE DATE - Monday, 16th November 2020 (PST)
Please can you all submit your PBIX files to powerbichallenge@enterprisedna.co
The data set can be downloaded below.
Challenge 9 Data.xlsx (100.2 KB)
Best of luck!
Any issues or questions please reach out.
Haroon
Enterprise DNA
