Here’s the entry from one of our non-member participants, Krishna.
To learn about the real-life scenario presented for the challenge, be sure to click on the image below.

Here’s the entry from one of our non-member participants, Krishna.
To learn about the real-life scenario presented for the challenge, be sure to click on the image below.
This post is part of the Enterprise DNA platform improvements, through the Data Challenge our members can now share how they built their dashboard and what their inspiration is in building it. We hope all members can utilize it efficiently.
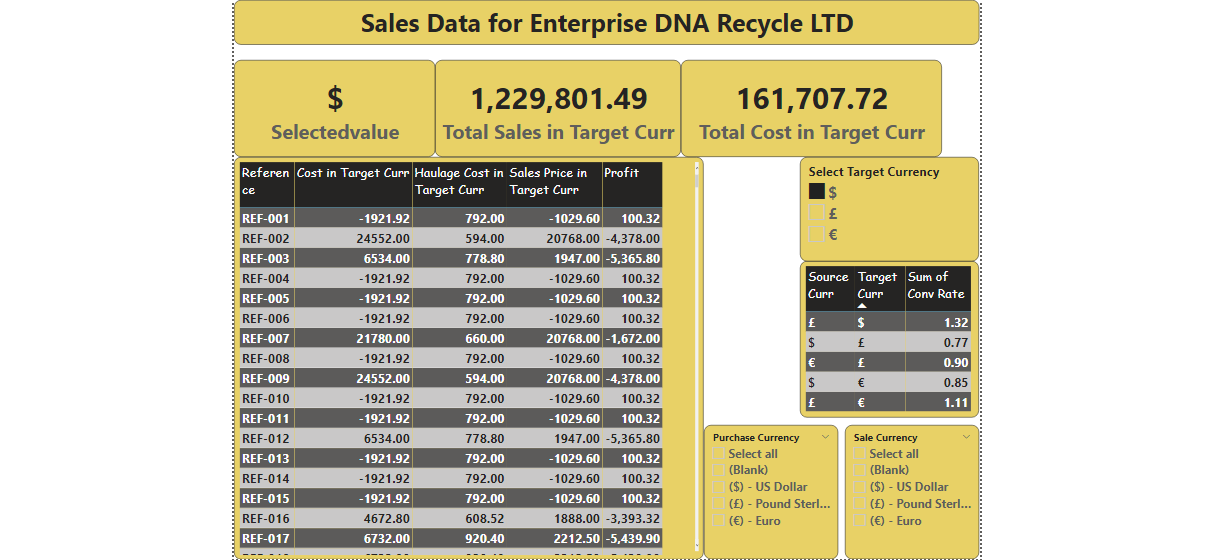
OK I think you’ve made a good start here but obviously there’s a little bit to go in terms of building out a solid reporting solution.
I’m interested to learn more about how you found the challenge, and what you were trying to learn while you were working through your submission?
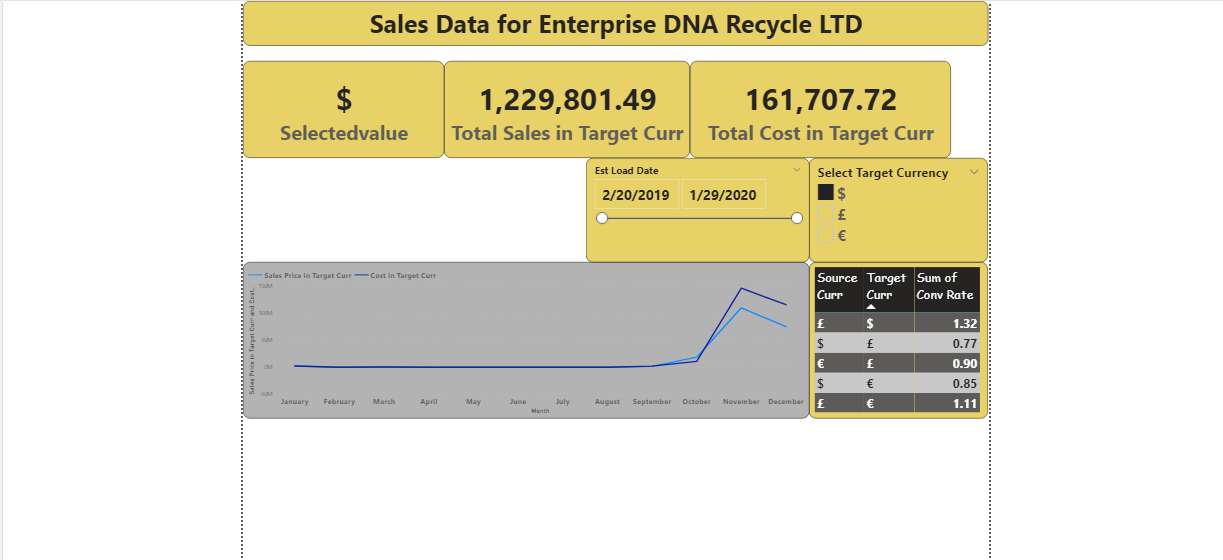
Maybe the idea here would be to just create a few more actual visualizations than just a table. If you look through a lot of the other entries there’s been a lot of creative ways that users have built navigations, but also mainly the visualizations which represent the data and tell the story of the data.
And I think that is something that you might want to have a look at is learning how to tell a better story around the information you have been provided. There’s also a range of different design techniques especially around grids and use of colors that I recommend diving into as well.
Nice effor here look forward to seeing your improvement next time.
Sam