@EnterpriseDNA,
Here is my write up for Challenge 9,
This was a complex Dataset. It took me some time to come up with a report but it was a learning experience and I truly enjoyed it. Thanks again for these challenges.
Edna Waste management LTD is doing business in different currencies and the requirement was to analyze transactions in all the currencies.
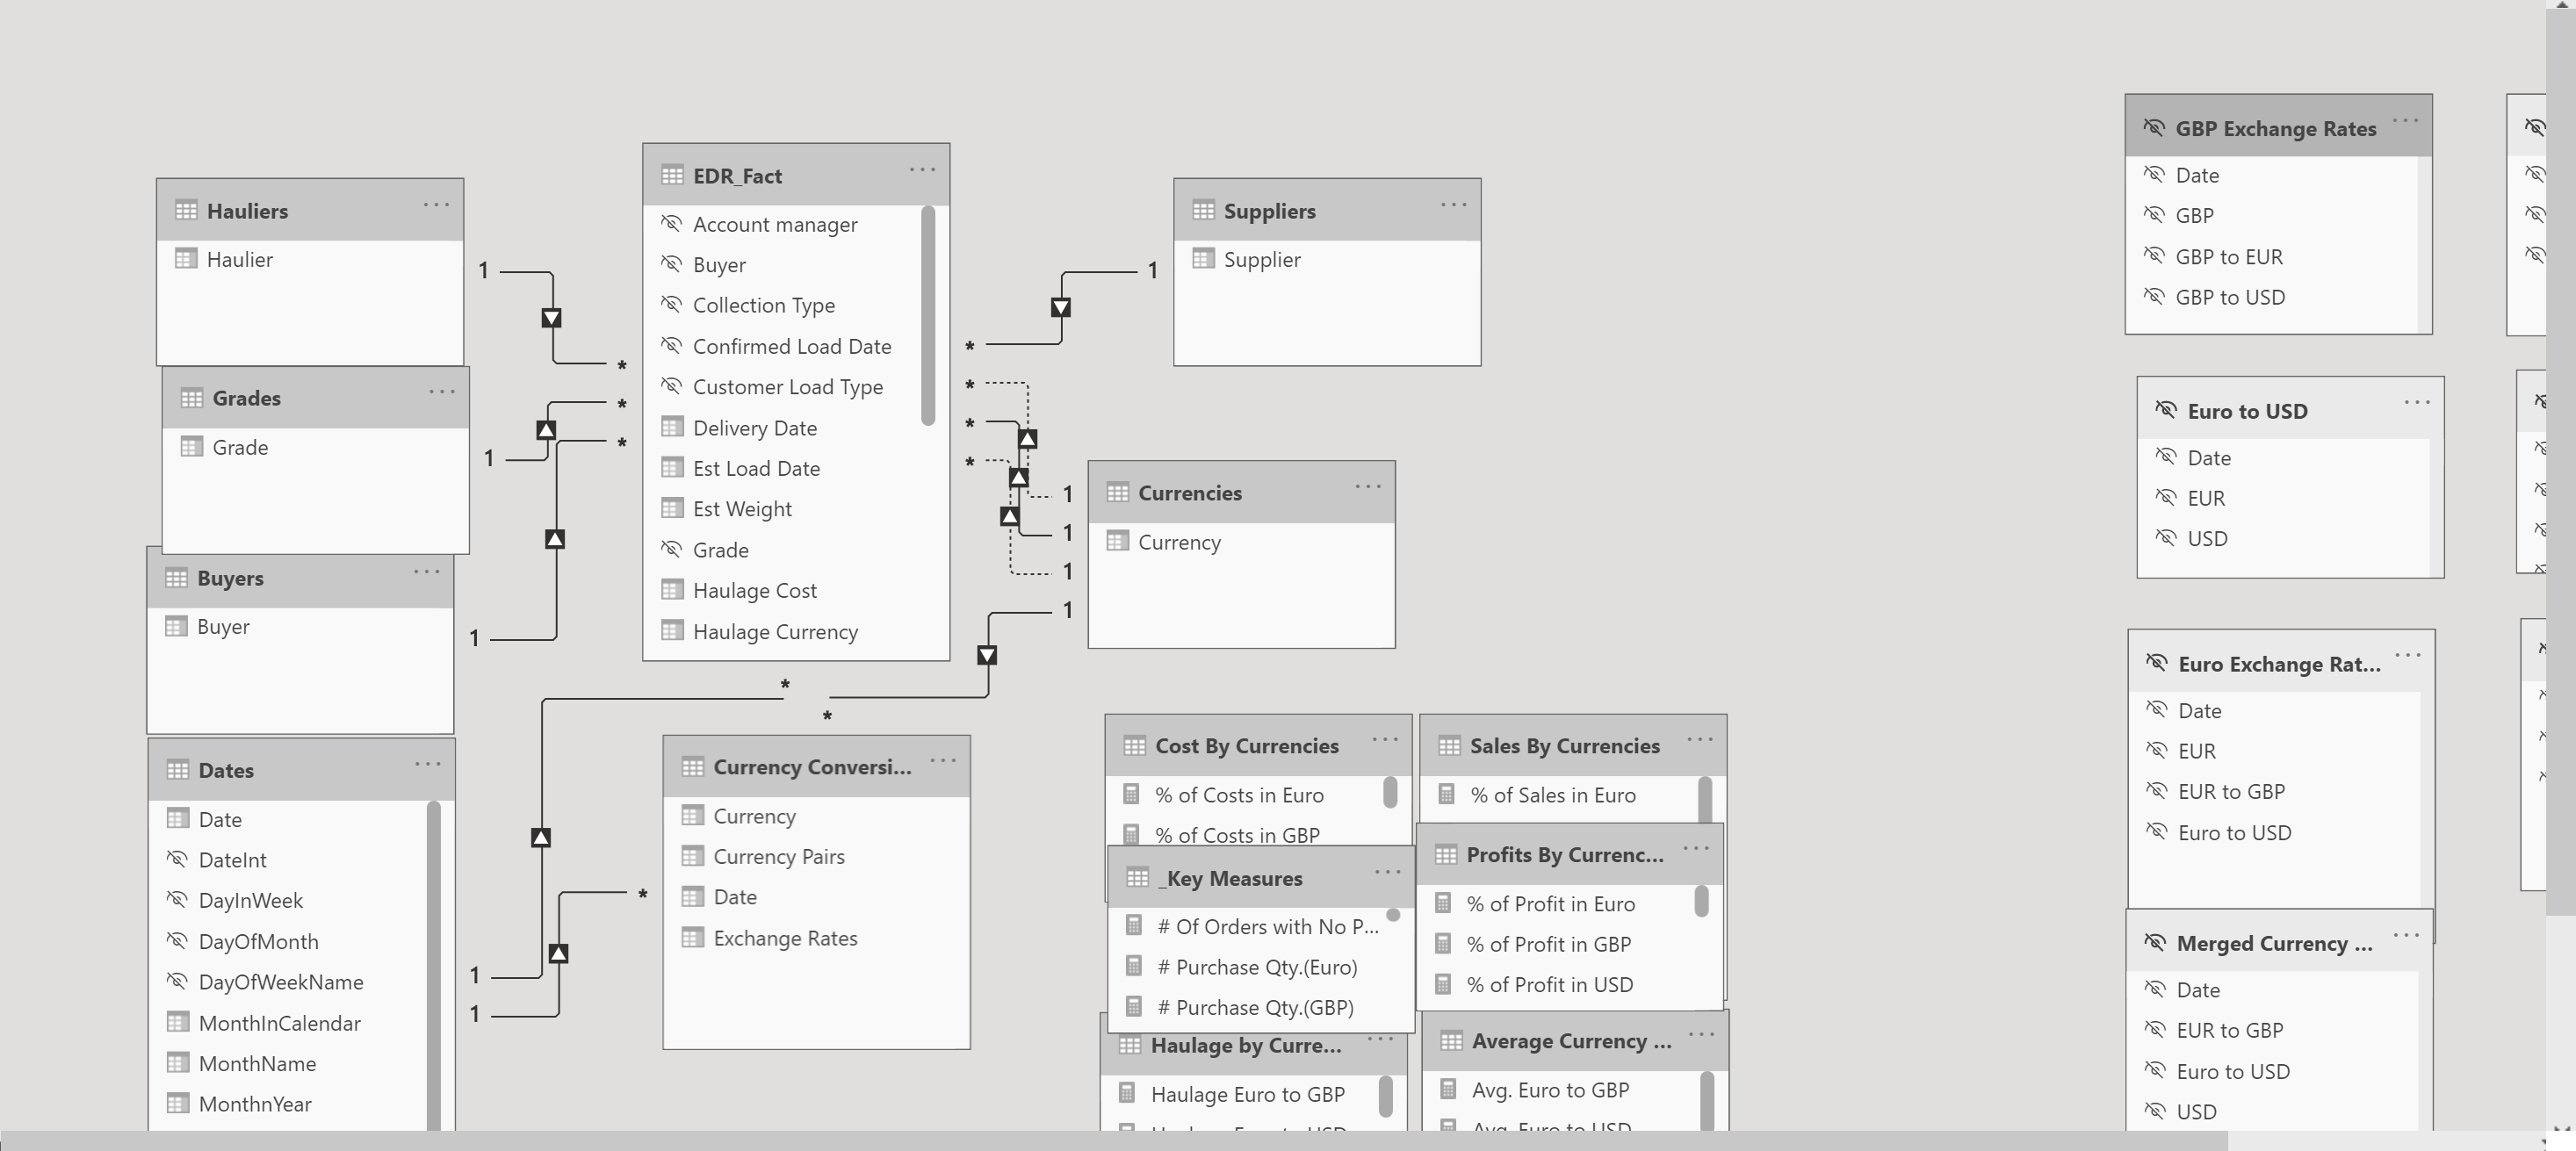
Data Model :-
I used Power Query to extract unique values and to create the following dimension tables:-
- Haulers
- Grades
- Buyers
- Suppliers
- Dates
- Currencies
and
- Currency Exchange Rates
Data Model:-
The Currencies table had an active relationship with Sales currency column and inactive relationship wit purchase and haulage currencies.
Currency exchange rate table has no direct relationship with the fact table instead it has a relationship with currencies and dates tables.
For currency exchange rates, I downloaded a currency rate Excel sheets from ExcelRates.com for each currency rates referencing the minimum date and maximum dates from the source table ( ‘01/01/2019’ and ‘02/28/2020’ respectively ).
Then I merged all the currency rates tables and unpivoted the columns which gave me currency rates from one currency to another for each day.
DAX Calculations:-
For the all the sales and other transactions in different currencies DAX calculations, I used average rate for all the dates and each currency rate.
For instance, for Pound sterling to Euro exchange rates The below DAX calculation was used :-
Avg. GBP to Euro =
CALCULATE(
AVERAGEX( ‘Currency Conversion Table’ ,
‘Currency Conversion Table’[Exchange Rates]
) ,
FILTER(
ALL( ‘Currency Conversion Table’ ) ,
‘Currency Conversion Table’[Currency Pairs] = “GBP to Euro” ) )
For Sales by each currency, I used
price * estimated weight
For Instance, for Sales in Euro the following DAX was used ,
Sales in Euro =
CALCULATE(
SUMX( EDR_Fact ,
EDR_Fact[Unit Sales Price] * EDR_Fact[Est Weight] ) ,
EDR_Fact[Sale Currency] = “Euro”
, EDR_Fact[Sale Currency] <> “No Currency” )
To convert the sales in Euro to other currencies, for instance, sales in Euro was multiplied by Average exchange rate.
Sales in Euro was converted to USD this way:-
Sales Euro to USD = [Sales in Euro] * [Avg. Euro to USD]
I created all the sales in different currencies and converted each amount to other currencies like above.
For the costs the same method was used except I added Haulage cost to the total based on the currency. ( I used the same calculations as above for the Haulage costs )
E.g.
Cost in GBP =
CALCULATE (
SUMX ( EDR_Fact,
( EDR_Fact[Unit Purchase Price] * EDR_Fact[Est Weight] )
),
EDR_Fact[Purchase Currency] = “GBP”,
USERELATIONSHIP ( EDR_Fact[Purchase Currency], Currencies[Currency] )
) + [Haulage in GBP]
Visualizations :-
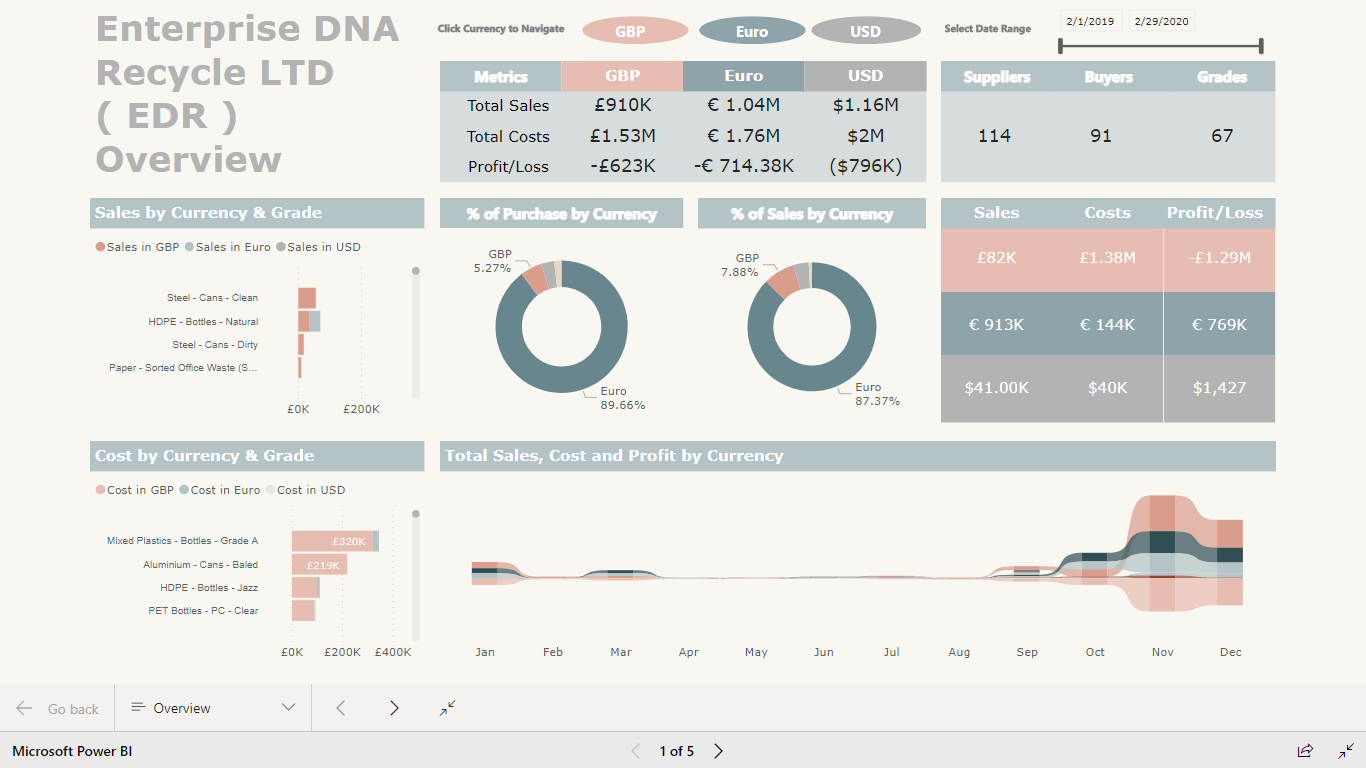
The first page of the report shows Total sales, costs and profit/loss converted to each currency and
transactions in each currency.
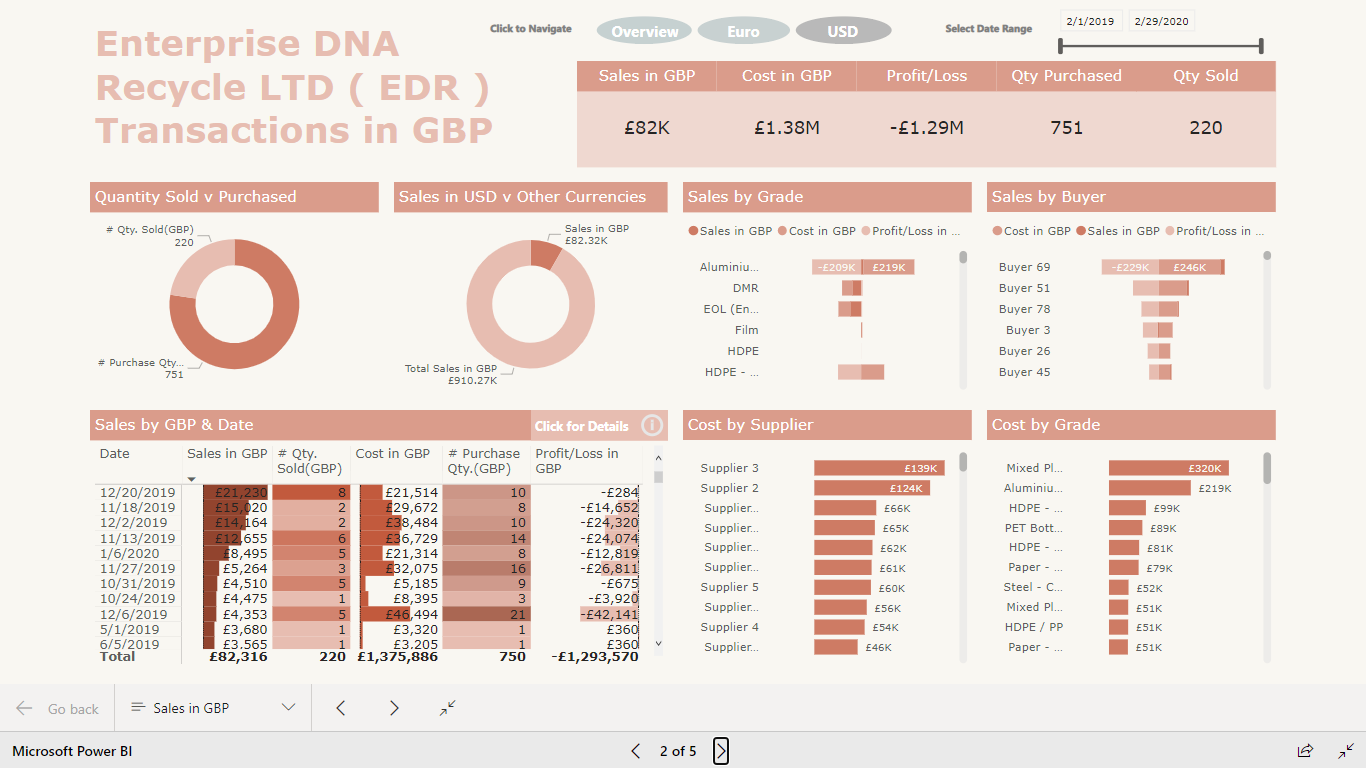
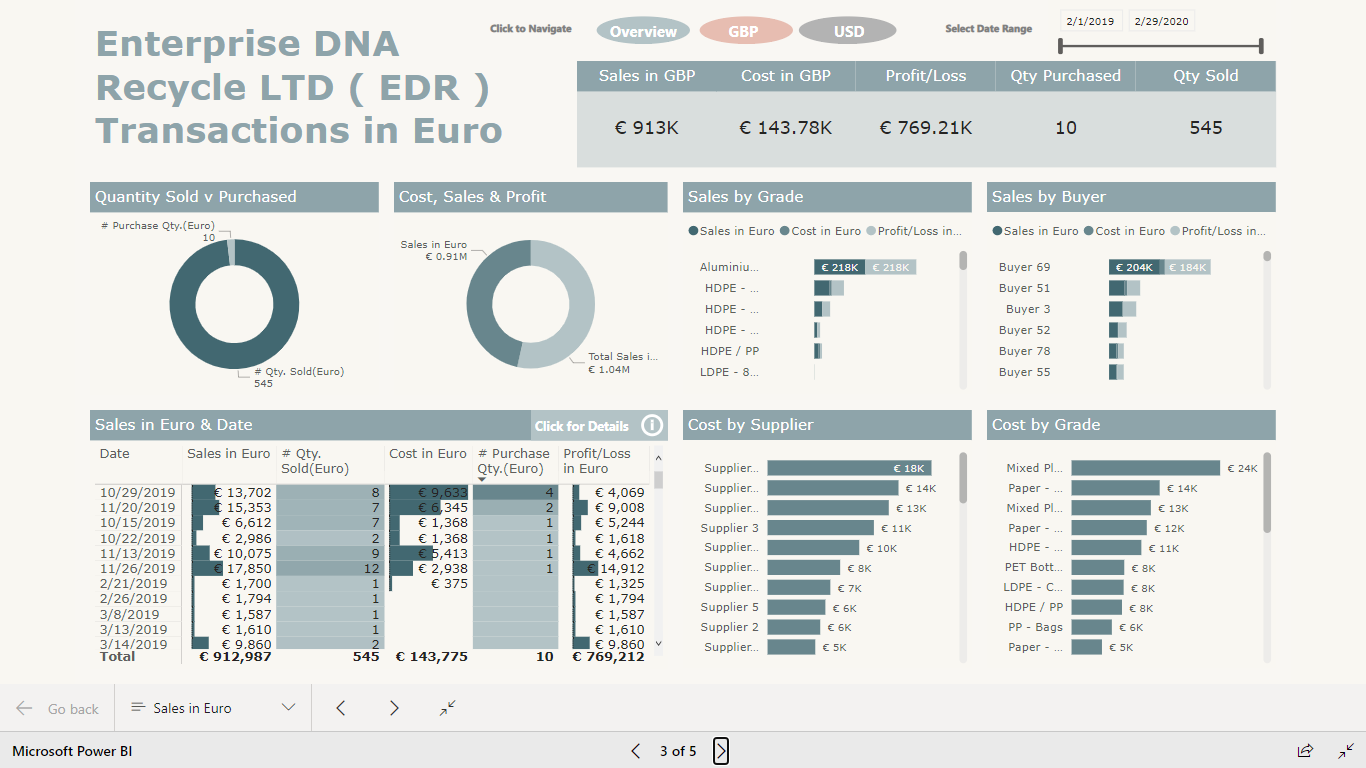
I used different color themes for each currency so the end user can identify what they are looking at by the color themes on the pages.
They can also see details of each currency transactions by clicking a button that takes them to a details page.
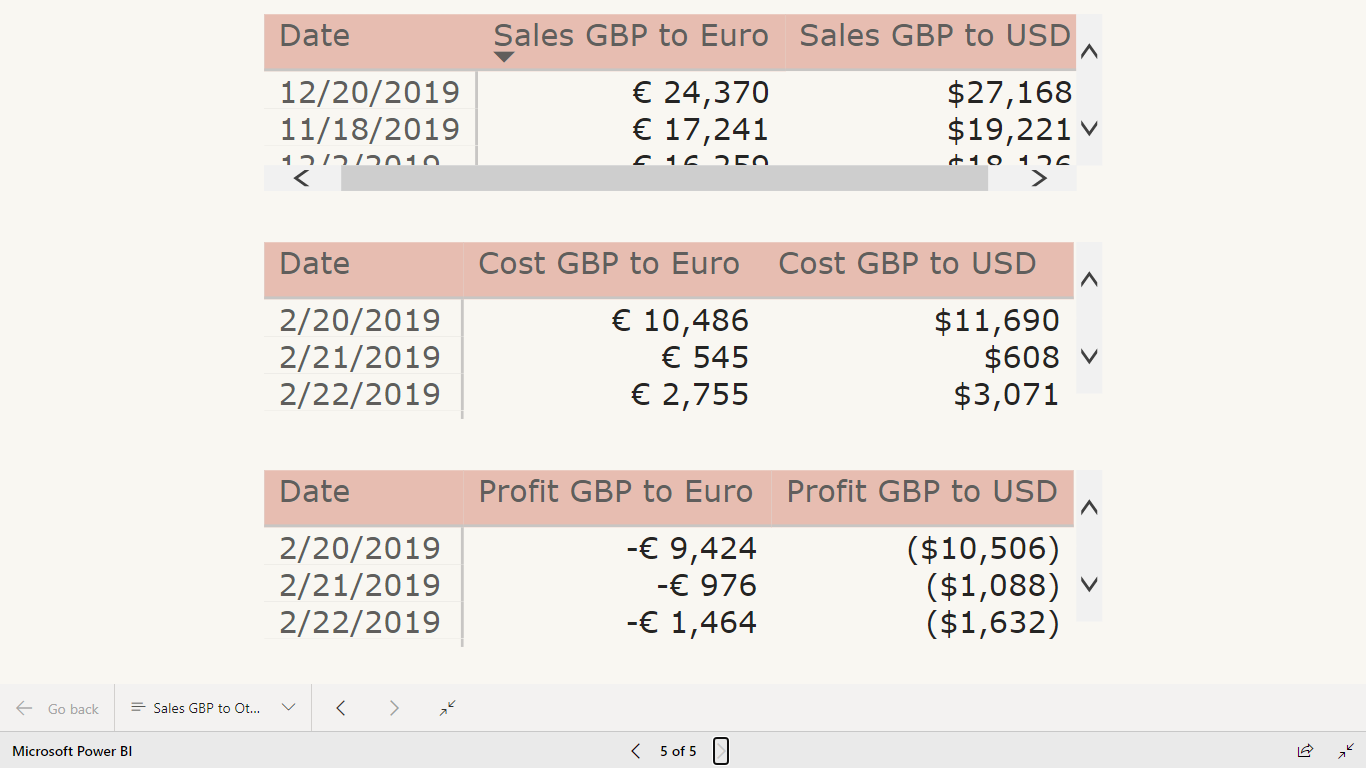
I used tooltips to show converted values for each currency to another on the Matrix tables.
Thanks and Regards,
Nebiyu
P.S. My apologies, I tried to format the DAX formulas but it goes back to unformatted formula when I submit.