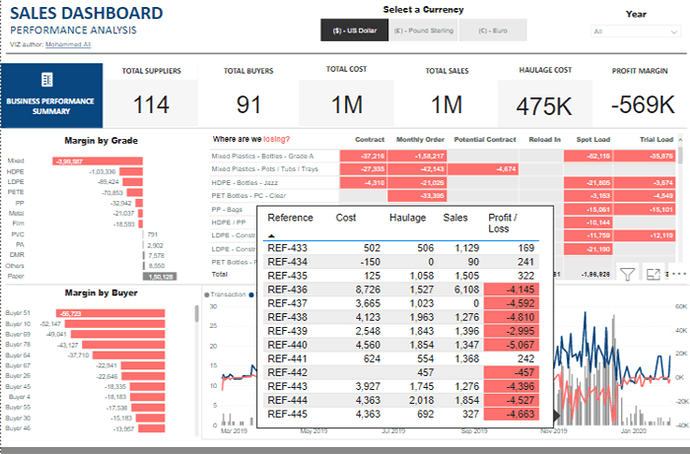
Here’s Mohammed’s entry for Power BI Challenge 9. @Mohammed_ali, feel free to add other details of your work.

Here’s how Mohammed described it:
This is my submission to EDNA Power BI Challenge 9.
The main challenge is to create a conversion model with 3 reporting currencies. I used Google sheets to get the daily fx rates with
=GOOGLEFINANCE("Currency:USDGBP", "price", DATE(YYYY,MM,DD), DATE(YYYY,MM,DD).This dashboard displays key metrics like Sales, Cost and Profit of a fictional recyle company. My main goal is to find loss making attributes in the dataset.
Main requirement is to produce a report from the data to give the user the ability to select a currency and see the associated sales and cost. I also used tooltips to provide additional insight. Hardest part is to calculate the profitability, Sales & Cost as we have multiple currencies involved in the business.
Please let me know your view, feedbacks and suggestions in the comments below.
To learn about the real-life scenario presented for the challenge, be sure to click on the image below.
