Power BI Challenge 10- Supplier Insight

Challenge 10!!

Hello All, I trust you are well.

An awesome milestone with this challenge we hit the big 10. It’s been an incredible past few months and the work produced in the challenges has just been spectacular, innovative and in some cases incredible.

We started the challenge to help provide an opportunity to get hands on and implement the skills that you are learning.

We are continuously trying to improve and enhance the challenge offering at Enterprise DNA and that’s why there are going to be some super exciting changes coming in the near future.

We truly believe that the challenge is an excellent opportunity for all our members and non-members to get involved and enhance their Power BI capabilities. We already have a number of excellent prizes and categories available, but we’ve got some seriously cool stuff lined up and its coming soon so watch this space!

I know I keep banging on about it, but we really want more of you to get involved in this and were definitely trying to listen and ensure that the challenge is accessible to all.

As always if you have any suggestions or comments, we are always happy to listen. Please feel free to reach out to myself or the Enterprise DNA team.

Check out the post below to learn about the challenge.

First time participant winner

Really simple, its open to all Enterprise DNA members. All you must do is let us know it’s your first challenge.

There is some amazing loot on offer not to mention the learning opportunity and free membership on offer.

We really want to see more of you get involved so even if it’s a post to the forum to join the conversation please do get involved.

To learn more about the challenge and how it works be sure to check out the forum below!

If you’re not sure of anything just reach out to me.

Remember: The weekly winner will receive a complimentary membership to the platform that they can share with anyone and the opportunity for your work to be showcased across our channels.

To learn more about the challenge be sure to check out the forum post below.

The Brief

You are working with a manufacturer who receive and order a number of raw materials which are then used in production or for general maintenance.

Currently there is no procurement system in place and no way for the companies to validate which suppliers are providing us with quality goods and which are not.

There is also no consistency between different plants and the vendors we are purchasing from.

The programme management team have identified the need to centralise and understand supplier quality as a priority.

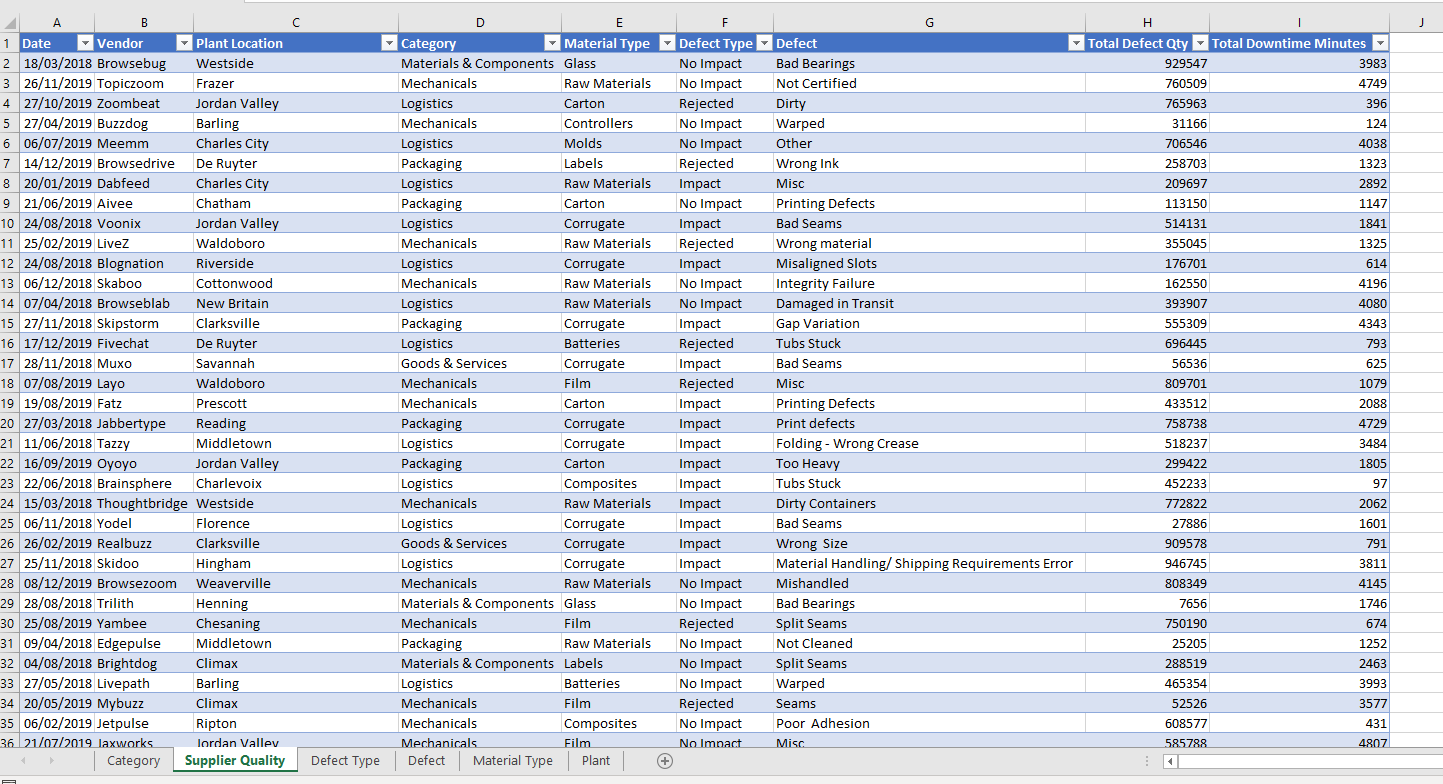
There has been a major effort in recent weeks to consolidate the data.

The team have now managed to gather data from across the plants with information around the material, defect and vendor.

They have also managed to get the number of defected materials and also provided a value for the minutes of downtime caused by the defected material.

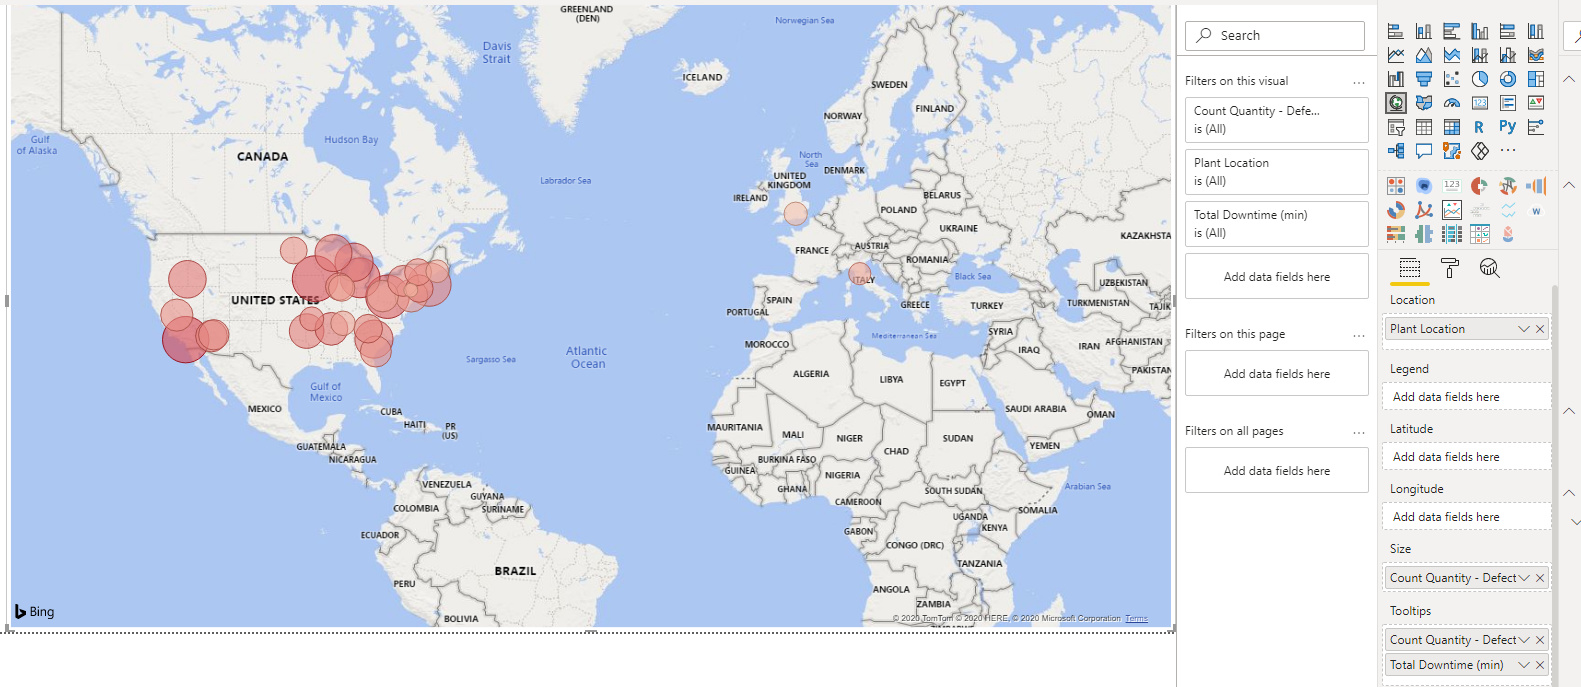
The management team are now looking for some help to visualise and extrapolate the findings from this data.

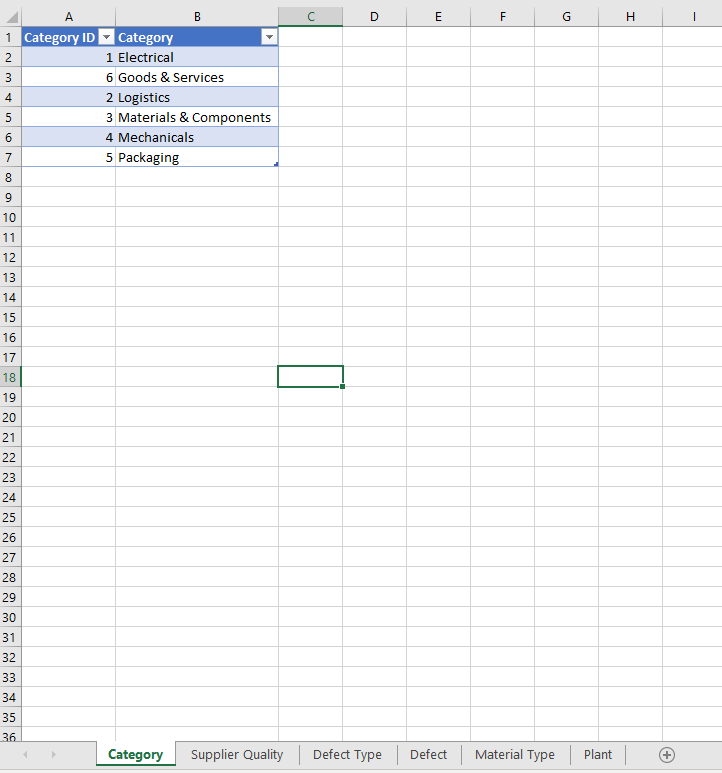
Enterprise Manufacturers Ltd are slowly adopting Power Bi within their organisation as such one of the analysts has made an effort at starting to model the data.

Given the importance of the project and urgency management have decided to enlist the experts to get this over the line.

Some key questions the business want answering are;

Which vendors/plants are causing the greatest defect quantity?

Which vendors/plants are causing the greatest downtime?

Is there a particular combination of material and vendor that perform poorly?

Is there a particular combination of Vendor and plant that performs poorly?

How does the same vendor and material perform across different plants?

The business are hoping that you can help answer these questions and maybe even provide some insights that they may have overlooked.

UPDATE Re @alexbadiu question around purchase amounts

At the moment this data is not available as the business are struggling to get the data out of the system.

It has been agreed that if the management team see value in this first iteration of Power BI development they would be willing to invest in the technical expertise required to extract the purchasing quantity.

The management team are happy to accept in this first instance they wont be able to see percentage of defects compare to purchased amount.

SUBMISSION DUE DATE - Monday, 13th December 2020 (PST)

Please can you all submit your PBIX files to powerbichallenge@enterprisedna.co

The data set can be downloaded below.

Challenge 10 supplier data.xlsx (311.6 KB)

Best of luck!

Any issues or questions please reach out.

Haroon

Enterprise DNA

12 Likes

@haroonali1000 Just in time for the similar project I have to work on in Jan 2021.
Great Choice :clap: :clap:

2 Likes

@haroonali1000, I have a question regarding the Total Defect Qty. In the dataset provided we do not have information regarding the quantity of materials received. We only have the Total Defect Qty and Total Downtime Minutes.
Do we receive the exact same quantity for each material, from each vendor & plant?

Hi
is my first challenge.
I downloaded the raw data file and was looking at the tables.

Please correct me if I am wrong, but look like the facts table “Supplier Quality” for the Vendor, Category and the other attributes has already the values-description instead of the IDs.

Should when I bring the tables into Power BI, convert all attributes in the facts table into the corresponding IDs, so then can links the table and use the description for the analysis.

Thanks
Luca

1 Like

Hi @LucaB72. That’s generally the first step I do to more easily understand the data model; using merge queries to ensure only the IDs are in the fact table, if possible. This also has the benefit of ensuring only the facts are in your fact table(s) while the descriptions are in your dimension (or lookup) tables.
Greg

2 Likes

Hi,
in the file, if I am no wrong, in the fact table “Supplier Quality” we do have alaready the dimension descritions, instead of the IDs.

If I lookup (linkthe tables fact with the dimensions) will be by the descriptions and when using the dimensions from the dimension table will have only the IDs

Or I am missing something.

I attached two snapshop from the data as I see for the

from the few databse set I workd with, the dimension tables were linked to the facts with numeric lookup columns and then I used the dimension description from the dimension table for the pivoting/analysis

1 Like

@LucaB72,

Just by glancing at the data, I’m in agreeance that really the only data that is needed is the “Supplier Quality” data. There are some other things you can do with the other data, but I would think you could do everything you need from this one tab of data.

Thanks
Jarrett

3 Likes

Hi Alex,

Great question at the moment this data is not available as the business are struggling to get the data out of the system.

It has been agreed that if the management team see value in this first iteration of Power BI development they would be willing to invest in the technical expertise required to extract the purchasing quantity.

The management team are happy to accept in this first instance they wont be able to see percentage of defects compare to purchased amount.

Hope this helps.

Thanks,
Haroon

2 Likes

Hi @LucaB72,

Welcome to the challenge!

Jarret and Greg have made some great points to get you going also be sure to check out the previous challenges and write ups for some guidance.

As the brief said the company are making an effort to adopt Power BI and one of the analysts has made an attempt, but the ball is in your court to show them what good looks like.

If your stuck don’t be afraid to reach out.

Thanks,
Haroon

2 Likes

Hi @haroonali1000,

You might want to include that in the brief as an update so everyone knows when they are reading it. Related to the inventory purchased and struggling getting that information

thanks
Keith

1 Like

Hi @haroonali1000,

great challenge, looking forward to creating my first viz.
I have a question about plants, is there further information about location? are all plants located in the US?

2 Likes

Hi
just one point, on the tables provided, we have been given number of Defects in terms of Quantity and Downtown minutes, as absolute value.
No reference to overall quantity delivered and production time.

may be a defect quantity that in absolute quantity look high compared to the delivered amount is in percentage small and maybe within the acceptable tollerance.

However for this challenge, as stated due to the senior management start getting interested in the analytic side and use of Power BI will proceed with the defect quantity and downtime time as provided, and put as reccomandation to collect also delivered quantity and time for processing to have a more meanfull analysis.

luca

Hi @ErikaLoz,

Welcome to the challenge.

Currently there is no further data available, all plants are in the US.

Thanks,
Haroon

HI
when I plot the “Lant Location” and a map, the values for “Venice” and “Reading” it show me in Europe (Italy and UK, instead of USA Florida and Pensilvania)
Is there any way to force them to the correct geographical location without modifing the raw data supplied?

I attached the screen capture of the map viz

Thanks
Luca

1 Like

Hi @LucaB72. Shouldn’t be a problem … just add a new column for “Country” to your [Plants] table, set it to “US” and then add this to the map. Without latitude and longitude Bing maps tries its best but can easily give the wrong answer when place names are not unique (e.g., Venice, CA and Venice, Italy). Hope this helps. Greg

3 Likes

To add to @Greg’s comment, you may want to add “State” as well. There are several States that have “Venice” as a city.

image

Thanks
Jarrett

3 Likes

First timer on the challenge. I have been trying to make sense of the defects number, is there a base to compare the number of defects?

Just wanted to give a big :+1: to all the first time Challenge participants jumping in on this thread. Always great to have new entrants participating in the Challenge!

Also, as @haroonali1000 mentioned, every Challenge we offer some great prizes to the first-time eDNA member entrant judged to have the top entry:

  1. a copy of the Definitive Guide to DAX, 2nd Edition (the indispensable "bible"of DAX) or your choice of any other book from the eDNA Forum Recommended List ; or
  2. a copy of SnagIt 2021 , a do-it-all screen capture and graphics tool used by the members of the expert team for screen grabs, annotation, gif and video generation, photo editing, etc. @nick_m got me hooked on this, and it has a million and one uses for Power BI report development; or
  3. a four-month subscription to FlatIcon.com - this is an online service with millions of downloadable and editable icons that you can use to really polish your Power BI reports.

When you submit your entry, just be sure to include that you are a first-time participant.

Good luck to all! Can’t wait to see your reports.

  • Brian
3 Likes

Challenge accepted!

5 Likes