Here’s Scott’s entry for Power BI Challenge 10. @datasciguy, would you like to share how you built this dashboard and what your inspiration is in building it?
To learn about the real-life scenario presented for the challenge, be sure to click on the image below.

My Inspiration:
- K.I.S.S. - Keep It Super Simple. Turn the complex into something easy to understand. Don’t talk over the audience’s head. The only station people listen to is W.I.I.F.M., What’s In It For Me.
- Tell a clear story and directly address the purpose/problem intended to be addressed. If there are actionable insights, the audience will decide to proceed. If there isn’t, you may have wasted time working on something no one really cares about.
- Be accurate and relevant. Put numbers and statistics into proper context. The results should direct the audience to take proper action to solve the problem or issue. If the information you put forward suggests a course of action and that course doesn’t fix the problem, you’ll be looking for excuses or a new job.
- Reveal additional relevant data if the audience wants to do so, but don’t bombard them with too many options (nor give them too little). Allow them to “drill down” or get a more granular view if they are so inclined, keeping 1-3 above in mind.
Overview:
Business Problem: Concern about defects and downtime related to vendors and plants.
Problem Owners: Programme Management (non-analysts, statisticians, data scientists, etc.)
Challenge Objectives:
- Which vendors/plants are causing the greatest defect quantity?
- Which vendors/plants are causing the greatest downtime?
- Is there a particular combination of material and vendor that perform poorly?
- Is there a particular combination of Vendor and plant that performs poorly?
- How does the same vendor and material perform across different plants?
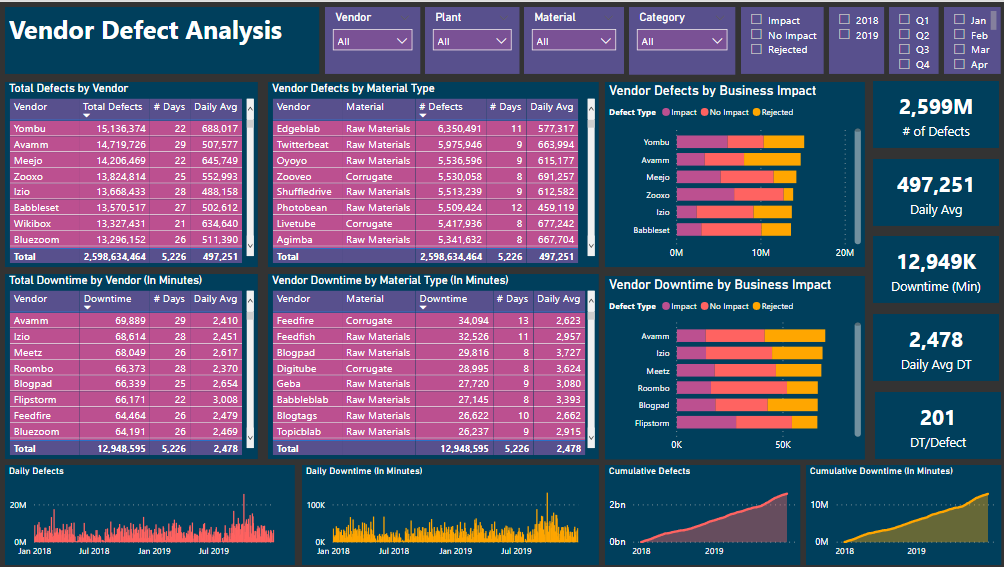
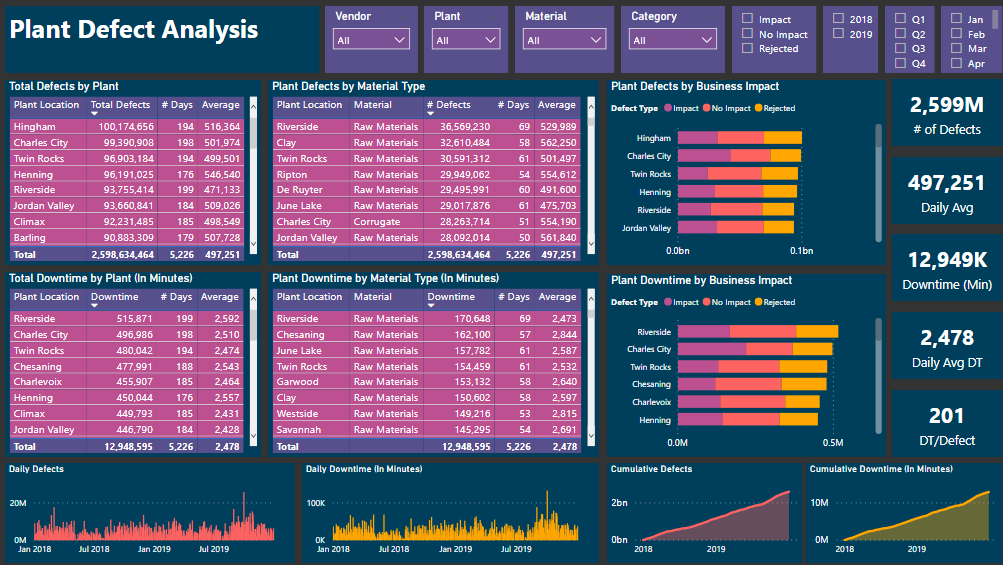
Structured Approach: There appear to be three main themes in the questions asked: 1) Vendor, 2) Plant and 3) Vendor/Plant. An additional inquiry involved material, so that needs to be incorporated in as well. The main concerns are around defects and downtime, so the reports will focus around those. Additional data included categories and defect type (which will be referred to ask business impact for purposes here). Business Impact is likely to be much more relevant initially, so it would be good to include a breakdown in the report.
Results: Developed three “dashboards” which allow the programme management to directly answer the questions raised. The Vendor and Plant Analysis reports have to sortable tables for each category - defects and defects by material. Since the “# of Days” included in the data set are different for each vendor and plant, raw total defects and total downtime figures will not allow for an accurate assessment. Absent of any specific information about quantities and production schedules, the best measure to use give the data is a daily average. This allows for a valid comparison between the defects and downtime from a vendor/plant that with 29 days to one that only has supplies on a few days.
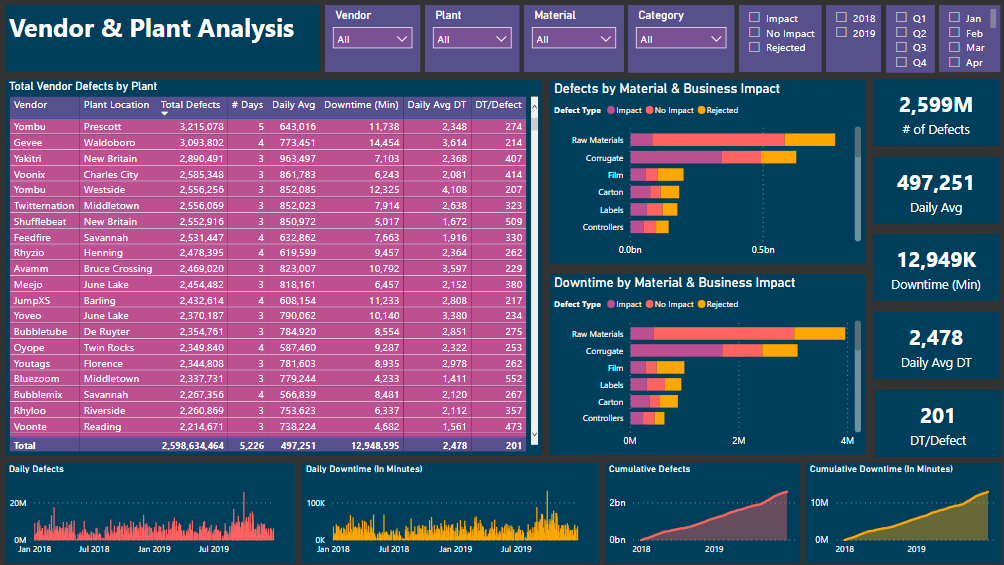
An additional measure is also included for downtime per defect. This would allow management to evaluate potential differences between defects types for different measures, particularly in defects by material types.
For the combination of vendor & plant, the measures are included again in a sortable table to allow management to see the pertinent information by simply clicking column headers.
Additional filters are added on top to allow viewers to take a closer look at any area of concern or a specific timeframe. (I personally don’t like to use a sliding time bar. It’s a little more tricky to get a specific time frame and it only allows for one sequential time frame. Purely a personal preference and could change based on the purpose of the project.) Time series charts are provided below to allow for quick visual cues for any patterns or trends that may be of interest.
Summary The report provides all of the pertinent information for management to get the answers they asked. It also allows for drilling-down in areas that they may want more information. Every section is easy to use and view data they are interested in. While the results may not be complete, there is ample information to “visualise and extrapolate the findings from this data.” I would expect the management team to see value in this first iteration, and would be very surprised if they were not willing to invest additional resources into utilizing Power BI for this issue, if not more.
2 Likes
Congratulations on your first participation to EDNA challenges @datasciguy ! I like your report and write up. I think you achieved creating a very clear report that answered completely the questions that were asked. I like the Keep it Super Simple approach & the strategy and goals you set up to approach the challenge. I completely relate to that and my approach to building reports is very similar.
I also like the consistent colors your used. I’m curious to see how your future reports will look like. 
Best regards and see you at the next challenge,
1 Like
Thank you, Alex! You are very kind!!