Here’s Mohammed’s entry for Power BI Challenge 10. @Mohammed_ali, would you like to share how you built this dashboard and what your inspiration is in building it?
Here’s how Mohammed described it:
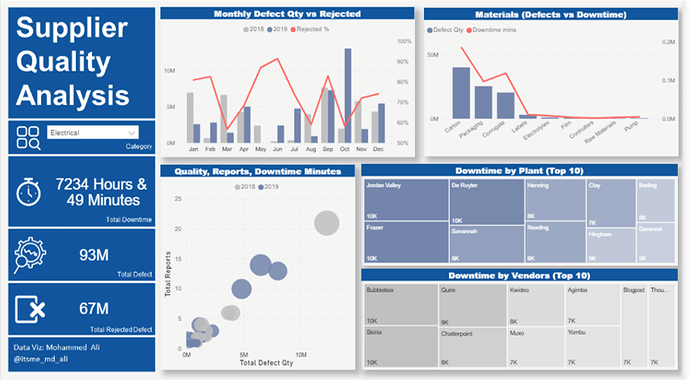
I have considered two key metrics for this challenge: total defects and the total downtime that these defects caused.
With that, I have created Treemaps to understand who are the worst vendors (top 10), with respect to downtime and identify which plants do a better job finding and rejecting defects, to minimize downtime (top 10). Any feedback and suggestions are most welcome.
To learn about the real-life scenario presented for the challenge, be sure to click on the image below.
