Power BI Challenge 10 - Supplier Insight from Rens (Newcomer)

Here’s Ren’s entry for Power BI Challenge 10. @Rens would you like to share how you built this dashboard and what your inspiration is in building it?

To learn about the real-life scenario presented for the challenge, be sure to click on the image below.

power-bi-chal-1

4 Likes

Hi there,

Thank you for uploading my entry. Below some ideas that I have used to build this report:

  1. I wanted to make the the layout as simple as possible (= not a lot colors). I used the Apothecary theme (https://docs.microsoft.com/en-us/power-bi/create-reports/desktop-report-themes), but only used the red color.
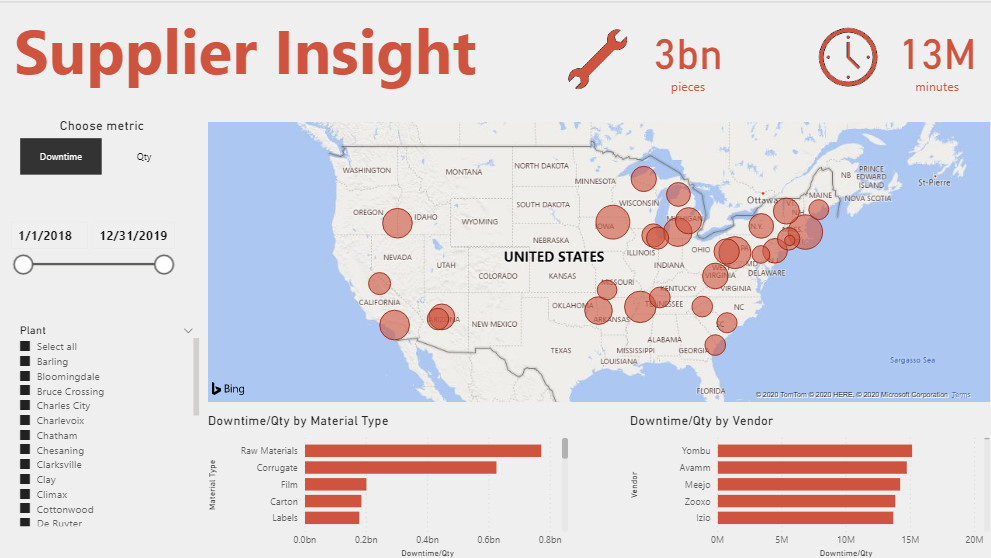
  2. I also restrained the amount of graphs. There is quite a lot of output that can be derived from this dashboard because graphs behave interactively.
  3. The “Choose metric” is related to a DAX formula which changes the output, based on which metric you select. This is by far the only big DAX development done.
  4. The Country US is added to the map to make sure we only see US countries. There are helpful comments from somebody Greg and JarrettM on the challenge that explain how to do this.

Open for questions!

7 Likes