Hi All,
I trust you are all keeping safe.
Its that time again, Challenge 12!
The bar is raised with every challenge and challenge 11 provided some brilliant entries and encapsulated what the challenges are all about. The work on display was by far some of the best Power BI development being produced across the globe.
Those of you that haven’t be sure to check out the reports and writeups.
To find out more about the challenge please see the link below.
https://forum.enterprisedna.co/t/about-the-power-bi-challenges-category/7619/2?u=haroonali1000
As always if you have any suggestions or comments, we are always happy to listen. Please feel free to reach out to myself or the Enterprise DNA team.
Admin
Couple of bits I just want to cover of before diving into the brief.
We have been listening to feedback and have decided that the expert panel will no longer be eligible to win.
However we believe there is massive value in the experts taking part in the challenges and the knowledge share and learning opportunities presented through their work. So going forward the experts will be in a whole category of their own.
There are a number of you who are interested in participating in the challenges however are a little unsure of how to go about preparing an entry.
Well, worry not expert @JarrettM has created a course taking you through his process of creating a data challenge entry step by step.
I highly encourage you all to set aside some time to go through the course. Really powerful material that provides you a basis of creating a report end to end in Power BI not just for challenges but any report development.
Awesome work @JarrettM ![]() .
.
There are also some super events lined up over the coming days with several experts going through data challenges and more so be sure to tune in.
Winners, prizes and categories
Were having a little shakeup this challenge as we have manged to secure some extra prizes.
The winners in each of the categories will receive the customary Enterprise DNA training membership but we have also manged to secure some cash prizes!!
This week’s entry has been kindly sponsored by a client who wishes to remain anonymous however below is a breakdown of the prizes on offer.
Winning Enterprise DNA member - $500 (Or amazon Voucher equivalent) + Free Membership
Most innovative Entry - $250 (Or amazon Voucher equivalent) + Free Membership (Open to both members and non-members and the overall winner can also claim the most innovative title)
Winning Non-Enterprise Member - $250 (Or amazon Voucher equivalent) + Free Membership (Open to everyone)
First time participant winner- Pick from a selection of prizes as mentioned here. You must be an Enterprise DNA member to qualify.
Not only is there an opportunity to win some great prizes while learning but you can also help shape the vision of what and how the client embeds Power BI.
Your work will directly impact and make a difference to the implementation of Power BI in an organisation.
The past 11 challenges have provided some of the best Power BI developments out there and the library we are developing through the challenges is second to none. So many options and inspirations to take into our own work.
I have seen several reports popping up across the web in recent weeks and for a number of them it has been evident where the inspiration is coming from.
So great work all we are making some serious waves and building one of the best libraries of Power BI work across the globe.
The Brief
As I mentioned earlier this week’s data set is courtesy of a client who are looking to use Power BI for reporting and analytics purposes.
They have taken an extract from the source system and dumped it into excel.
Under normal circumstances the team would then work with this excel and produce a number of reports through a series of pivots and templates and a whole lot of manual process.
They are now looking to use Power BI and automate this.
They haven’t asked for any specific requirement but rather want to see what’s the art of possible in Power BI.
So there really is no right or wrong answer here and the ball is in your court to produce a compelling report.
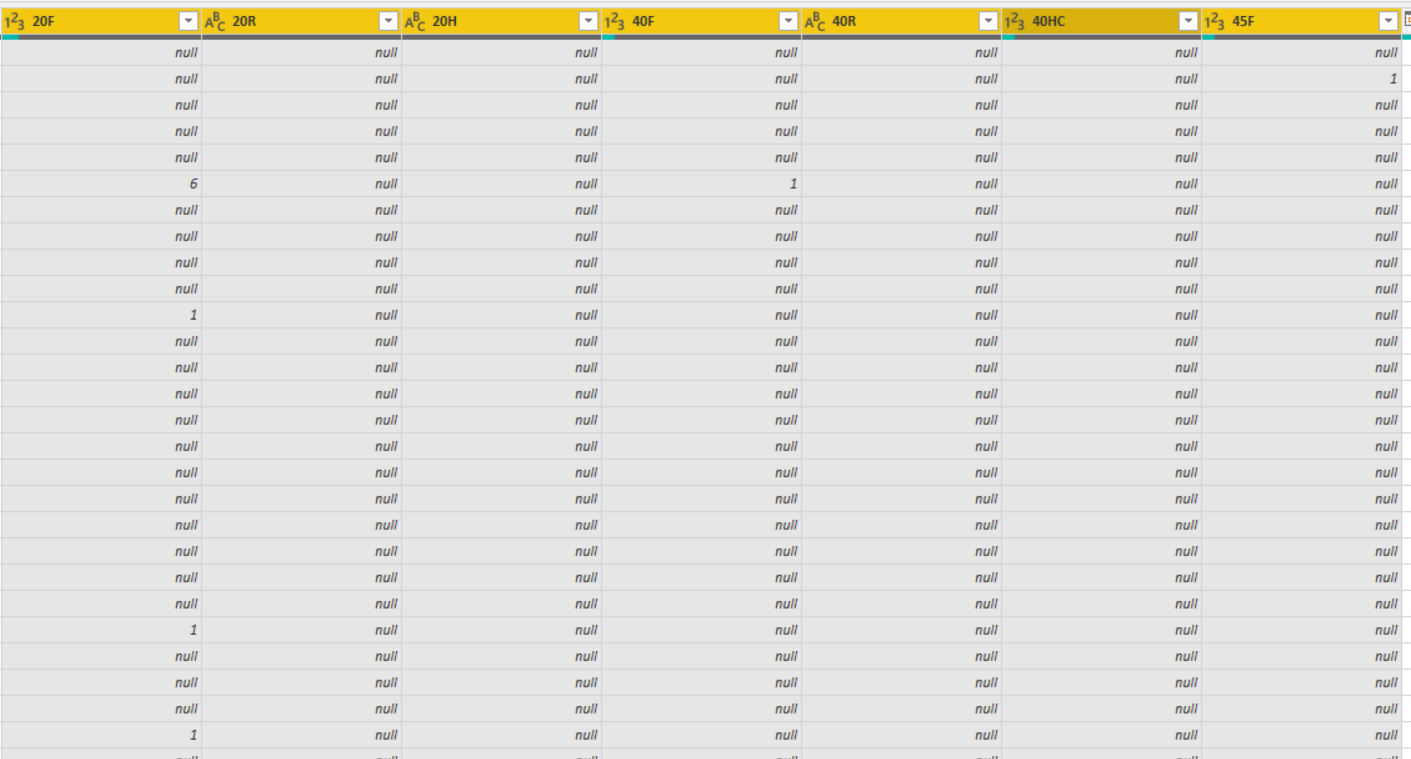
As you will see in the excel the number of columns is staggering and the data is far from optimal for Power BI reporting.
There is a data dictionary attached that covers some of the most important columns and what they mean.
There isn’t a requirement to model everything just what you feel is necessary.
The flat file extract to excel is common when working with source systems where a direct integration or middleware (data warehouse) isn’t available. Many companies prefer to keep reporting separate from operational systems to protect the operational system from any performance hinderance.
As with any good solution we at Enterprise DNA can’t emphasise the 4 pillars of development enough. So please bear this in mind as it will help structure your thought process.
So I now hand over the baton to you…
Any questions around the data and understanding of it please do feel free to reach out.
Conclusion
We really want encourage you all to get involved in some way shape or form so please do get involved even if its just sharing this with someone who might be interested.
SUBMISSION DUE DATE - Sunday, 28th March 2021 (PST)
Please can you all submit your PBIX files to powerbichallenge@enterprisedna.co
Best of luck!
Any issues or questions please reach out.
Thanks ![]()
Haroon
Enterprise DNA
Challenge 12 Data.xlsx (177.2 KB)