Here’s Timothy’s entry for Power BI Challenge 12. @tweinzapfel, feel free to add other details of your work.
Key Features
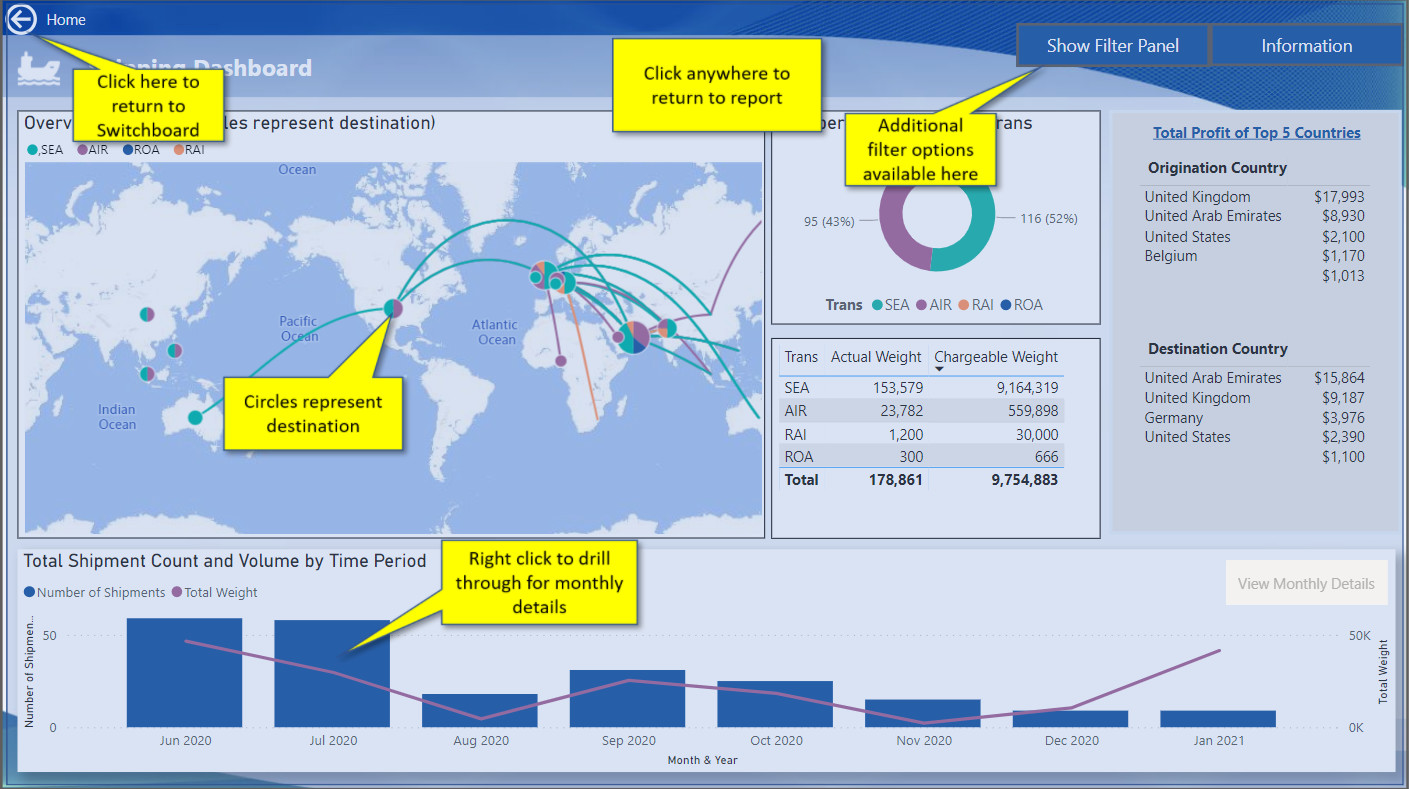
- Each page has a “Information” button that when clicked will highlight key items on the specific page. This would be beneficial in providing key information/features to end users who may not be familiar with the report. Clicking anywhere on the page will return the user back to the main view. (Feature courtesy of Guy in a Cube)
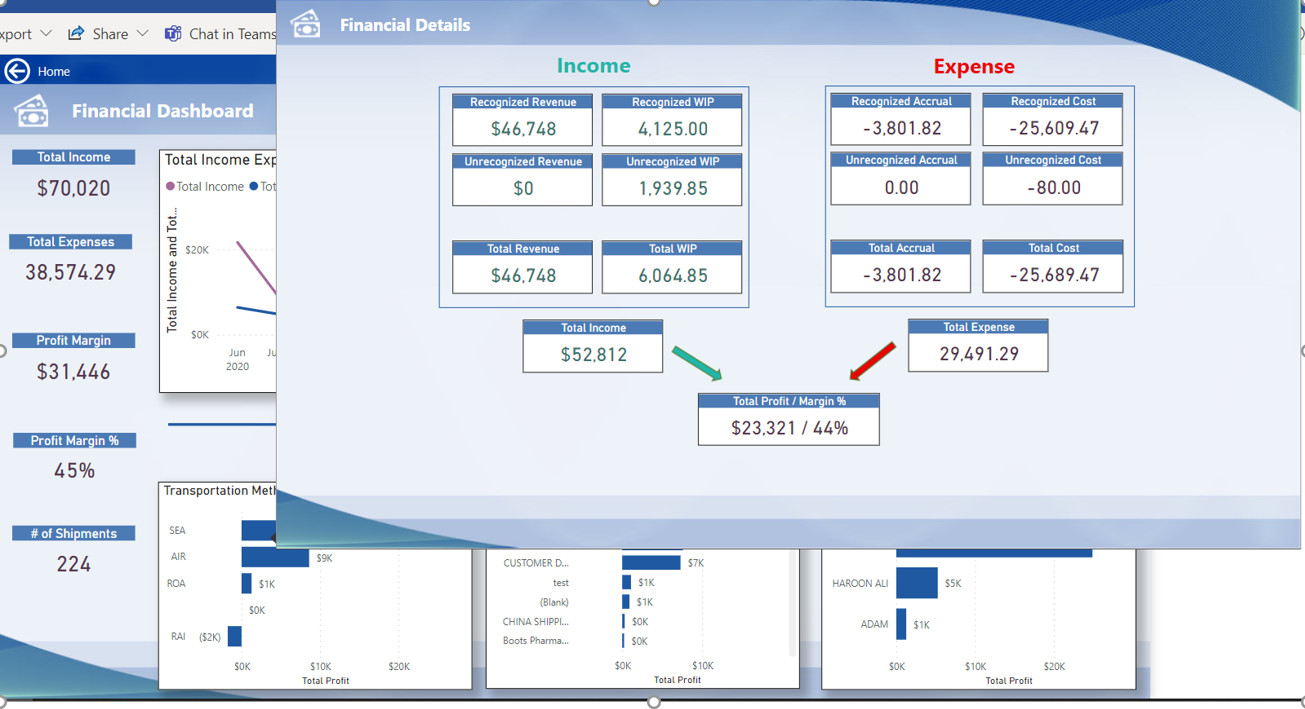
- On the “Financials” section, if a user hovers over the bottom charts, additional financial detail information is provided via a Tooltip.
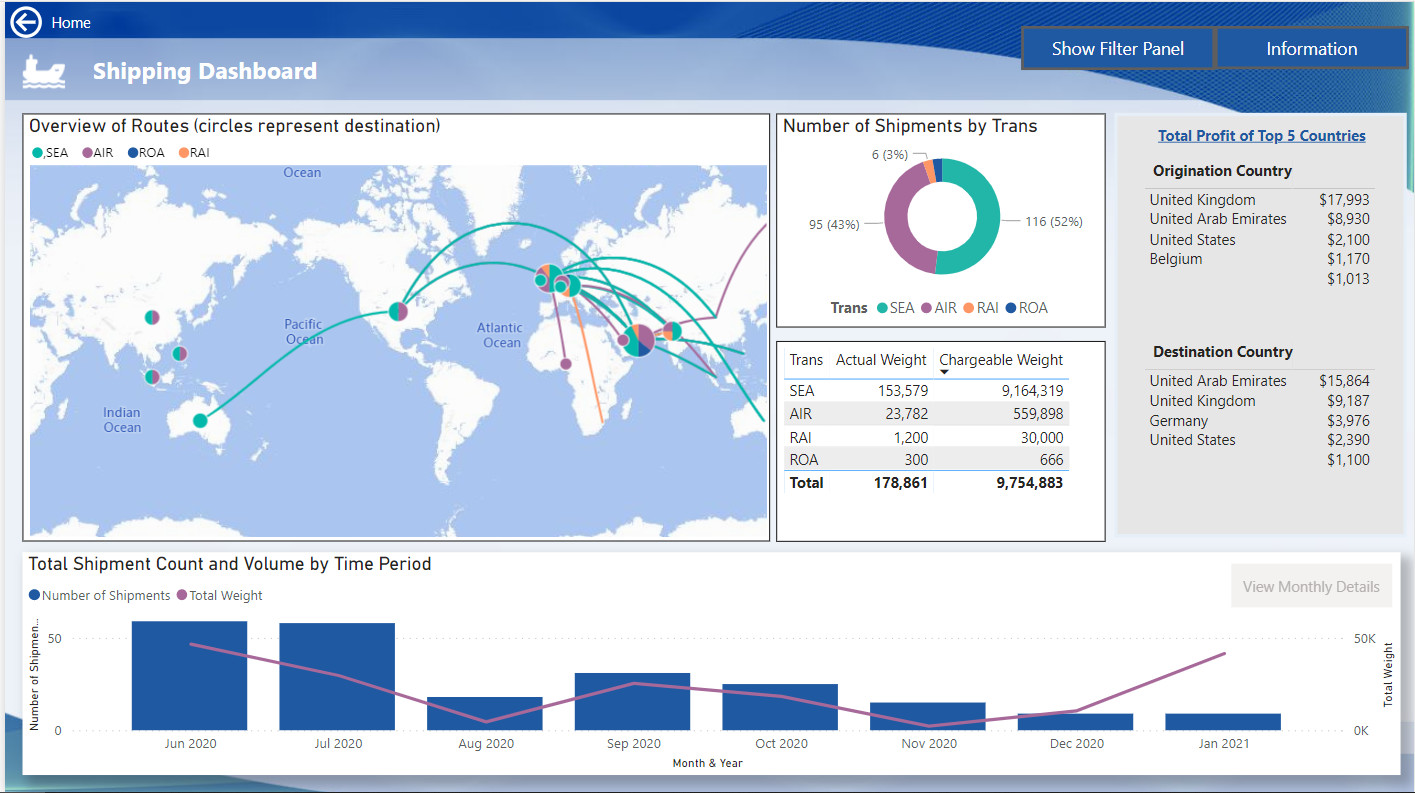
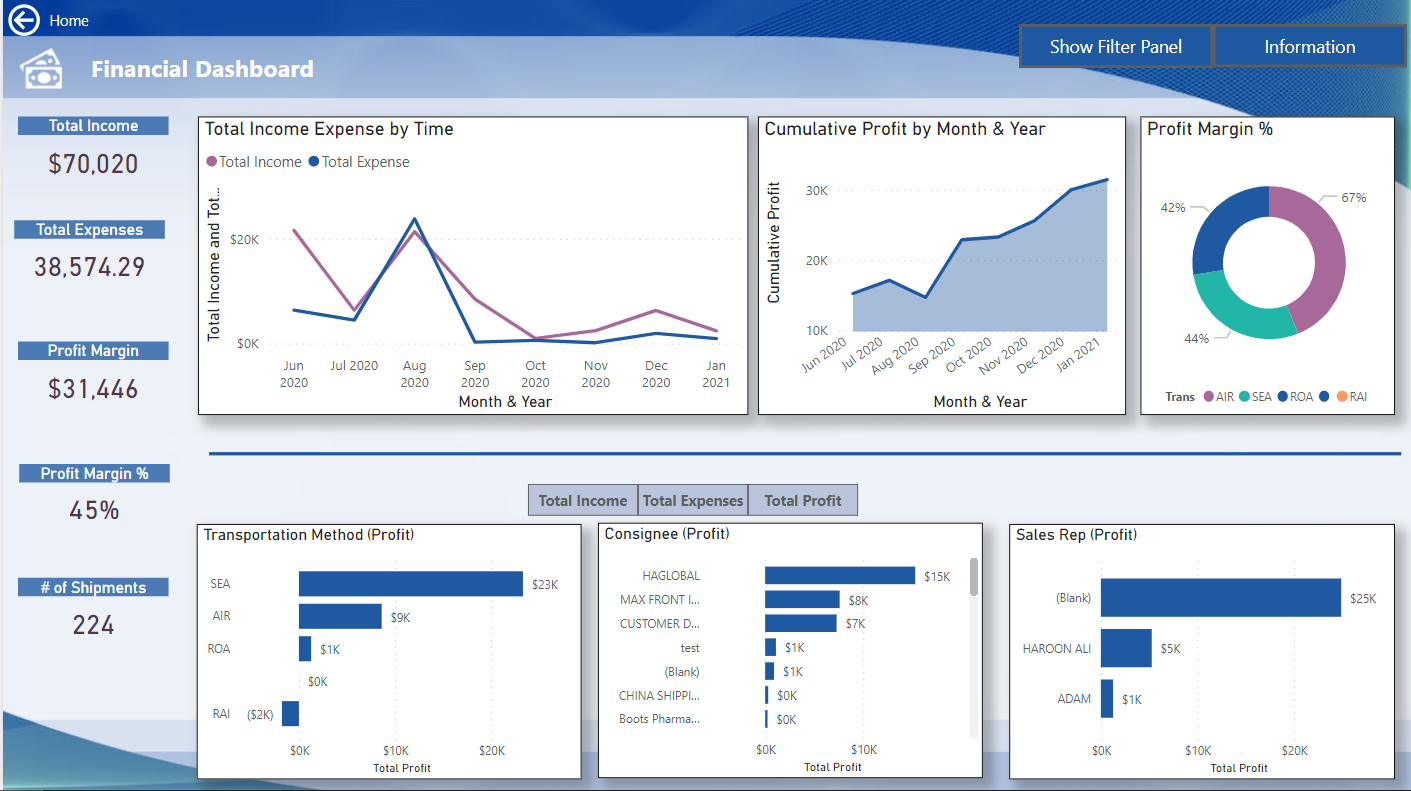
- Each page as a “Filter Panel” button that show/hides a filter panel. I tend to prefer Filter Panels that a user can show/hide as this provides more filtering options while maximizing real estate.
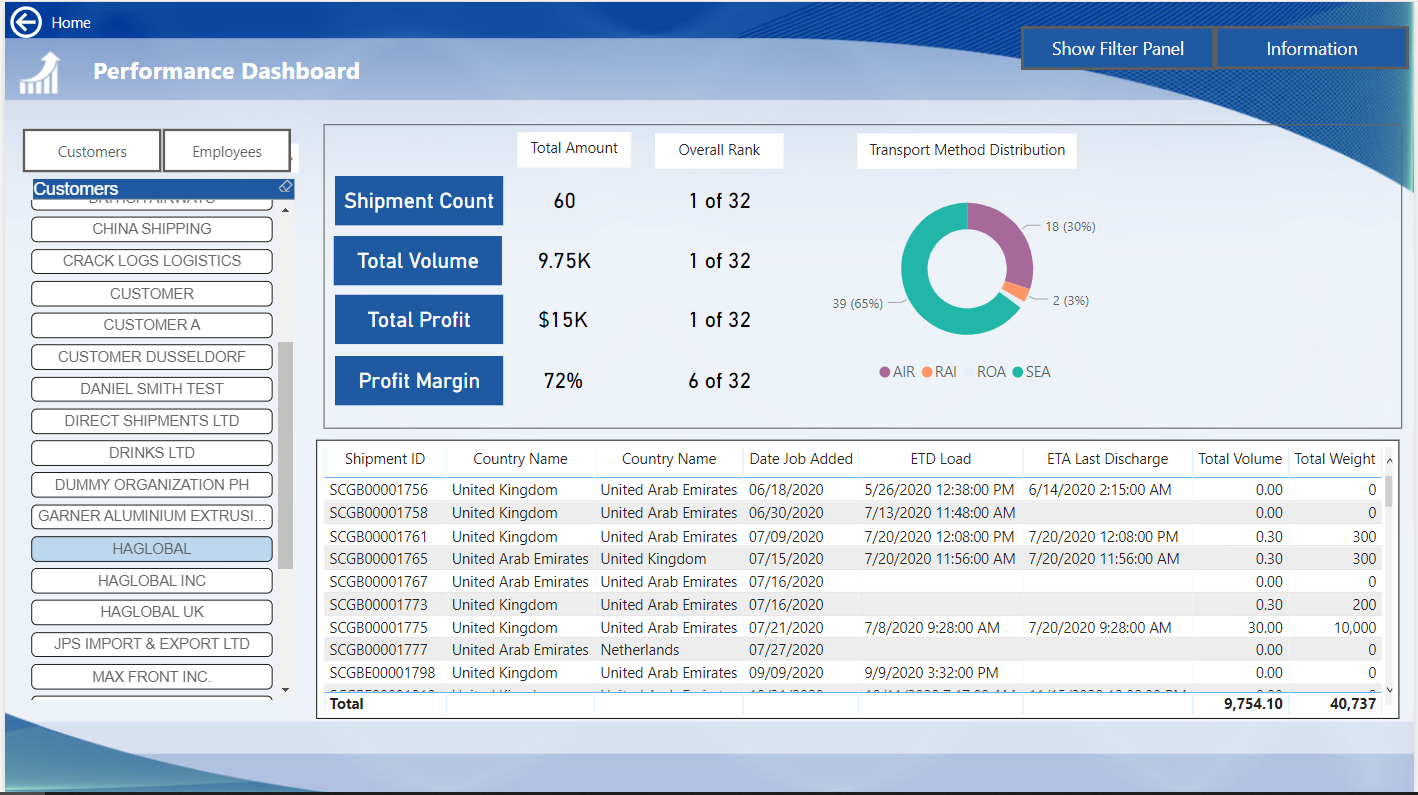
- There is a page showing KPIs that rank either customers or employees – and the user can switch between either. The measures are updated based on whether a customer or employee is selected.
To learn about the real-life scenario presented for the challenge, be sure to click on the image below.
