Hello Everyone,
Hope you are all keeping well.
Another week passes and another challenge draws to a close.
The standard of work was impeccable and its great to see so many different techniques and styles.
One of the amazing things around the challenge is the variety of participants and their backgrounds. Sharing thoughts and ideas from individuals with different background and expertise allows us to improve our vision of what’s possible and how we can sometimes see the same problem in a different light.
I want to give a quick shout out to @BrianJ who although couldn’t complete the challenge made an excellent post into the forum around reliability and validity. I would highly recommend you take time out and have a read. Thanks @BrianJ for the share not something I’d come across before but will definitely be taking forwward.
This is exactly what the challenge is about learning from each other’s experience and improving the quality of our work.
@Sam Also did an excellent write up and video on his thought process and how he went about tackling the challenge.
[HR Consultation Insights - Power BI Challenge #3 Summary]
I would love for more of you to get involved in this aspect of the challenge I know several you did share some great insights around your development, and it was great to see and very insightful. Please don’t be shy to ask any questions about sharing your thoughts.
A quote stolen from one of Sam’s post but one that resonates well with my self and captures the true beauty of working on these challenges.
“This diversity of thought is what is really going to take our members analytical abilities and critical thinking to another level.”
The winner
Picking the winner seems to be getting harder every week we evaluated the entries and the winner is……
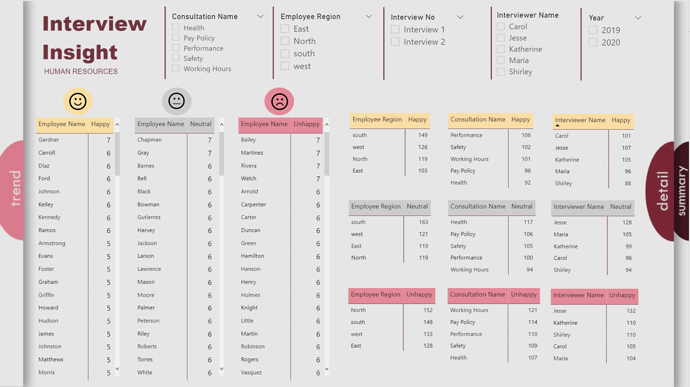
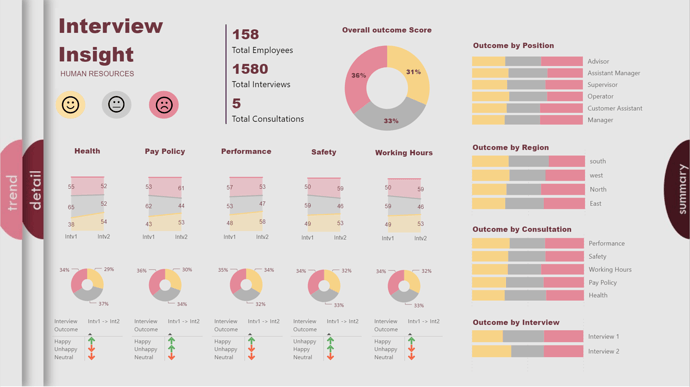
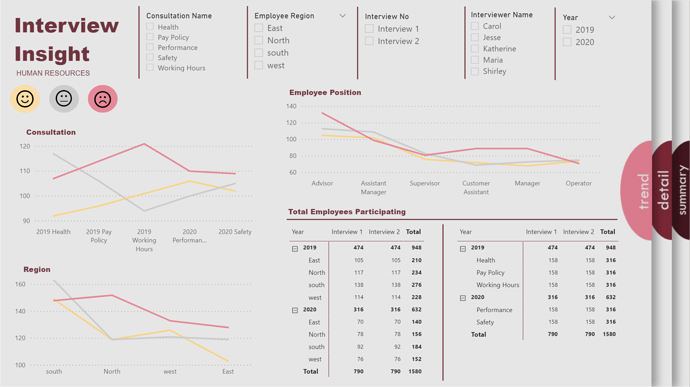
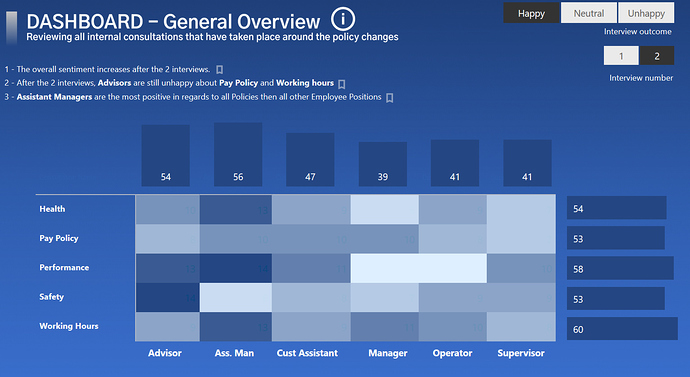
@DianaB. Congratulations Diana an awesome report that combines substance and style. I know there was some deserved hype around the theme and design of your report (loved it ![]() ). The PowerPoint template is a great way of creating report designs and something I would recommend that you are aware of as an analyst.
). The PowerPoint template is a great way of creating report designs and something I would recommend that you are aware of as an analyst.
@DianaB be sure to get in touch to receive your free complimentary membership.
There were some highly commended efforts from @Martin , @alexbadiu , @Greg, @JarrettM and @michaelsampsonidis
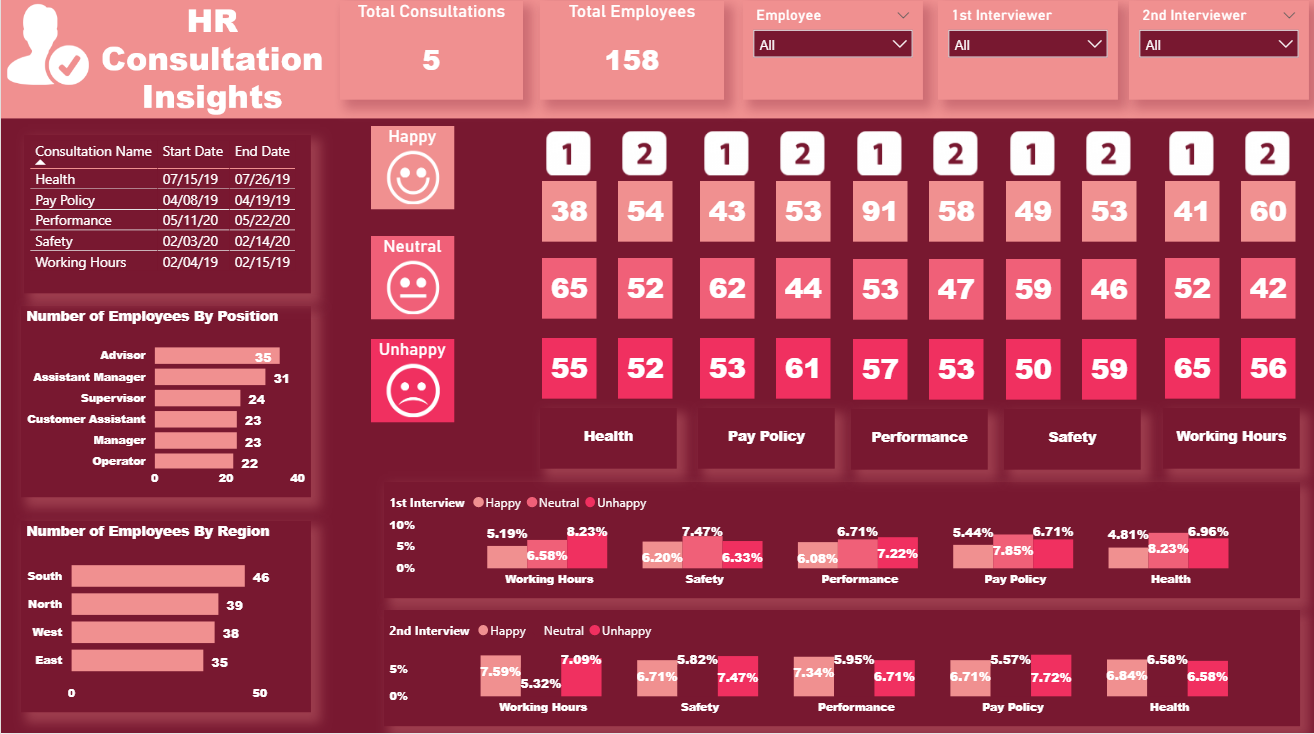
@michaelsampsonidis Submission
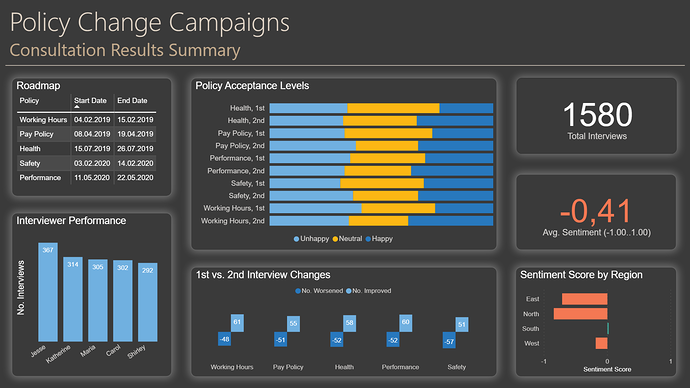
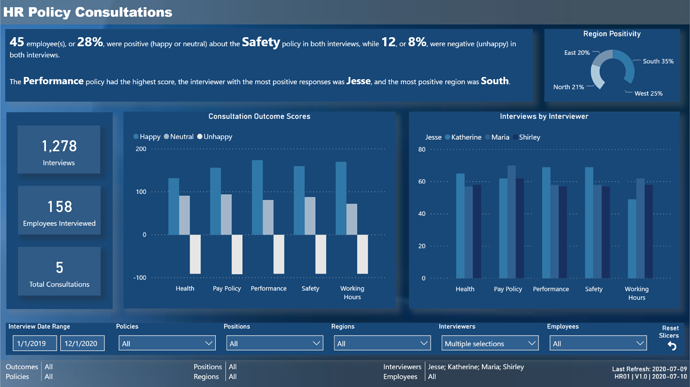
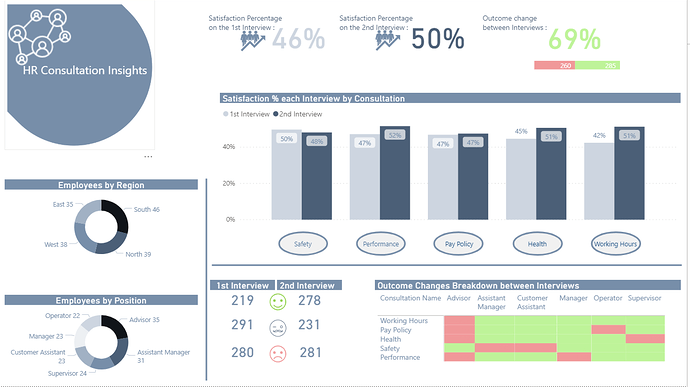
Honestly a massive well done to all participants we really enjoyed reviewing your submissions.
Feedback
The scenario this week was all about taking a flat table and then optimising the data set for reporting and Power BI.
It was great to see how you all identified the dimensions and facts and organised them in your models.
When working in industry its not uncommon that when you take an extract from source systems that they tend to spit out 1 large table so something you will often be required to do is transform this into a model suitable for reporting.
Upon reviewing the submissions I think there were two main approaches used around the fact table and the dimensions.
Approach 1 was to make the fact as thin as possible and this meant getting all your dates into 1 column and then having an interview number column.
Approach 2 was to keep two interview date columns and then use inactive relationships.
Personally I would always go for approach 1 and ensure that my fact is as thin as possible and considering the brief having a dimension/attribute for interview number was a plus.
There are pros and cons to both approaches and you can sometimes be adding in extra complexity where it may not be needed.
There were some great calculations and brownie points for those who assigned a numeric value to the outcomes and created a sentiment score.
The use of visualisations was great and particularly enjoyed the use of stacked column charts showing the outcomes. Was very effective at showing the changes from one interview to the next.
A key for any successful report is to ensure that you have slicers/filters set up to allow the users to change the view.
The key slicers/filters for this report would be the consultation name and interviewer its nice to have others but I would consider these to be essential. I always like to put myself in the users shoes when deciding what to have in my filters/slicers.
I know James is reviewing consultations so that’s definitely something he will want to see the data split by and actually reading the brief its members of his team who are conducting the interviews so I’m sure that will be something that he would want to look at.
I think the final point I will make, and I think many of you missed it is that there was opportunity to have an additional KPI which was around the consultation windows. So how many of the interviews were conducted between the window and how many were conducted outside the window.
So just want to say a massive well done to everyone who took part in the challenge and producing a great report.
Conclusion
I promised I would give some insight into the scenarios and as to how we are coming up with them and how relevant they are I will hopefully do another post covering this in depth so watch this space.
Thanks to all who participated, appreciate the effort you are all putting into this.
Please remember the challenge is all about you guys and helping you in your development if you have any ideas, concerns, issues or anything else you want to discuss then don’t hesitate to get in touch.
Feel free to email powerbichallenge@enterprisedna.co for any queries or reach out to me personally on haroon.ali@enterprisedna.co
Ok that’s enough from me.
Keep your eyes peeled for challenge 4 which will be released soon.
Any questions, requests or queries do not hesitate to get in touch.
Haroon
