This post is something of a “give the client what they have asked for and not what you think they wanted” vibe about it.
I had previously posted this a few months back and, as always, received some awesome help in solving it from the EDNA community.
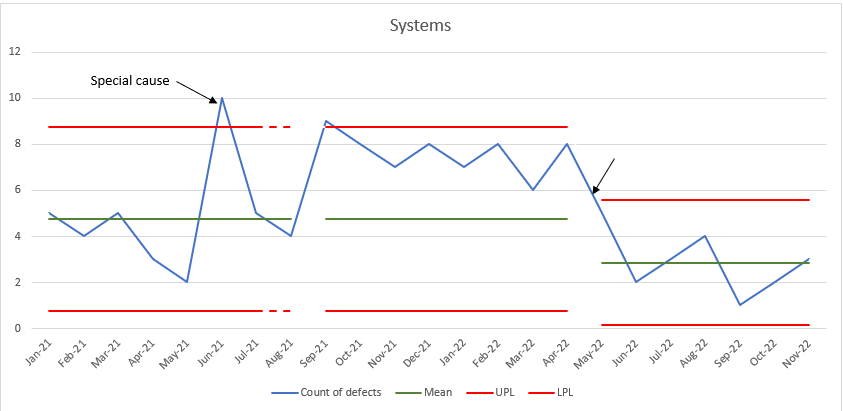
The client had asked for a graph which breaks up the months in 8 month periods and takes an average of the defects during the previous 8 months and then uses this figure to set a base level with upper & lower limits (UPL & LPL). The 8 Month Period was overcome/created by Melissa adding in an additional column in her world beating Date Table called 8 Month Fixed Period.
In the example data given to me there is a 2.66 number used, I was “informed” this had some roots in Standard Deviation. So, I thought I would be clever and create the graphs using Standard Deviation giving the user the option to select 0 Standard D’s, 1 SD’s, 2SD’s or 3SD’s. (When I say I would create it…Brian J did the heavy lifting) Present it to the client and they want to use their original calculation as the 2.66 figure has a basis in a benchmark they’ve used in the past…so my bad & lesson learned.
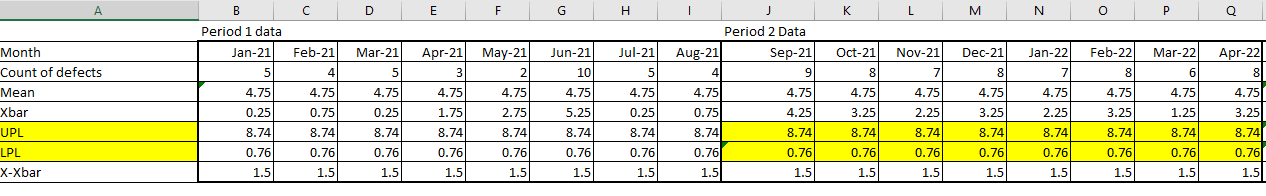
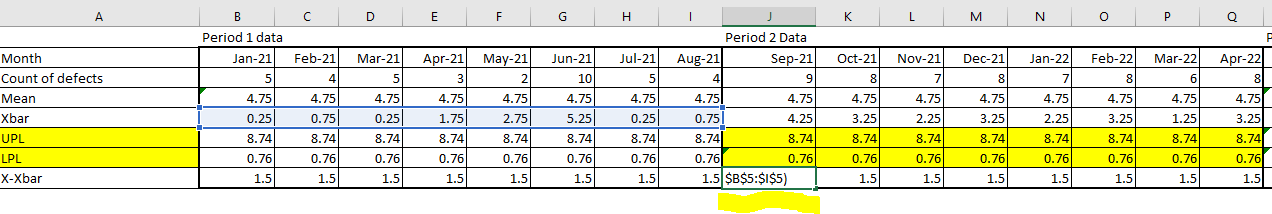
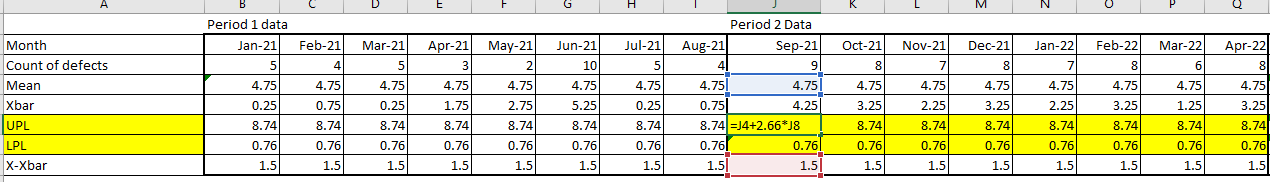
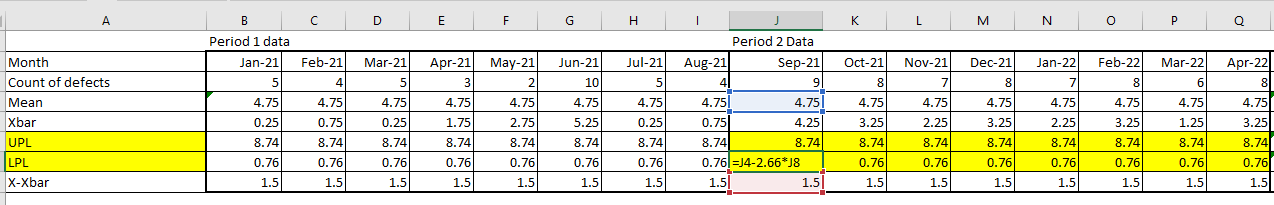
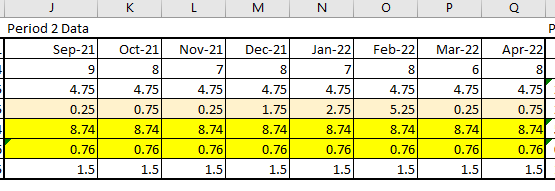
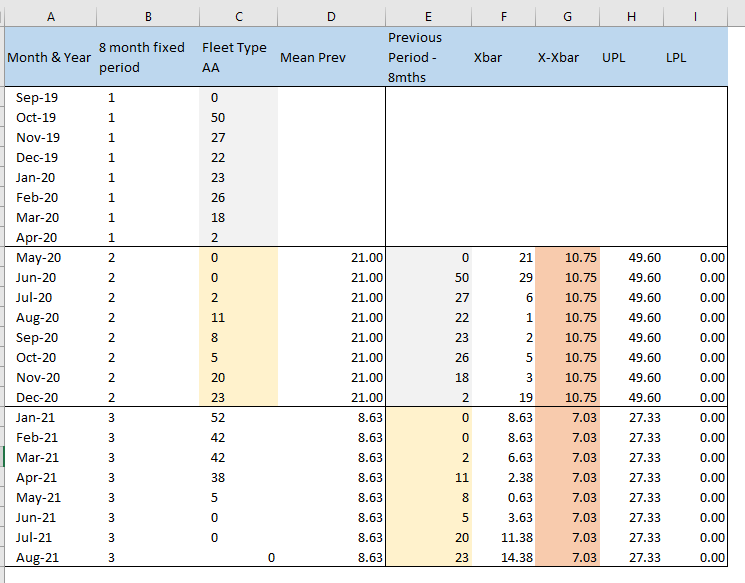
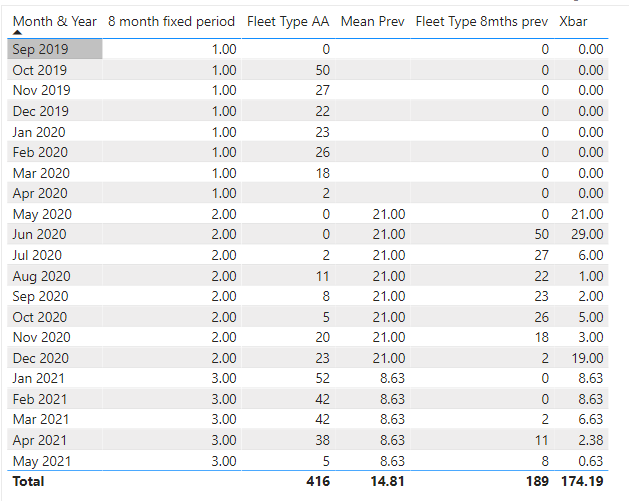
Picture 1 is from the client and picture 2 is from the PBIX solution from EDNA. I need to recreate the UPL & LPL lines but using the client calculation (which is in the attached Excel document & displayed in Picture 3). In the Excel file, please ignore period 1 data and focus on the yellow highlighted Period 2 Data for understanding the calculations.
I’ve tried to recreate it using their logic but I can’t get it to work.
Hopefully I’ve laid out the problem clearly, if not feel free to throw some objects at me…as the client already has
@BrianJ I apologise in advance, as I know it’s not protocol to tag someone into a post that is as yet unanswered, but since we worked on this before together I was hoping I could get your input on this one.
Yup, given the time we spend working on the initial version, I was planning on picking this one back up but have been delayed in responding since I’ve had a hard time making heads or tails of what they want. A few questions:
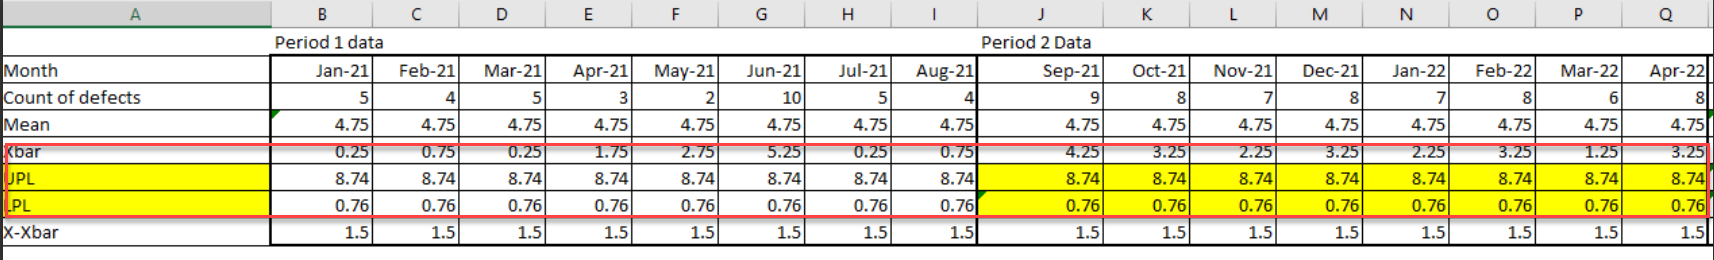
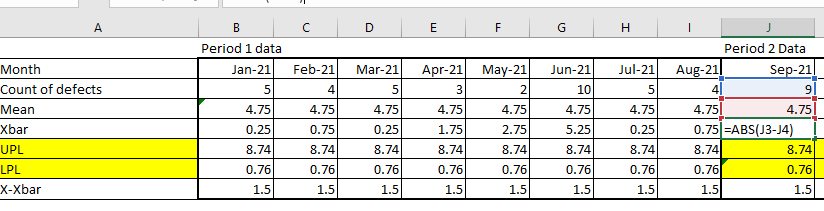
How are the fields highlighted by the red box below calculated?
What’s the relationship to the 2.66 variance figure cited above?
So, unlike what we initially tried to do in making the upper and lower bounds variable by allowing them to select the what-if parameter for # of std. deviations, that sort of what-if analysis is not longer relevant, correct? They just want a single upper and lower bound?
Once I have a better handle on what is is they’re looking for and where they are getting their number, I actually think producing this will be a good deal easier than what we did prior.
If my wordy explanation isn’t hitting the spot the enclosed Excel Test Data SPC.xlsx has the calculations in it.
Point 2 - 2.66 is a numerical standard they’ve used historically, I did ask for more clarity on why 2.66 but I didn’t get an answer that was any clearer than a dense fog
Point 3, yes, the What-If Parameter is no longer relevant.
I think I may have confused matters by not having the formulas correct in one of the rows, specifically the Xbar row (highlighted above the yellow lines). My apologies on this. Updated Excel attached also.
I think I’ve set the data out better this time, I’m really struggling to create the X-xbar DAX measure, I think once that is created I’m good to go. The X-xbar is the average of Xbar over each 8mth period.
@BrianJ Thank you and I should take a moment to apologise, reading back through my original posting I became confused at what I was trying to achieve let alone asking for assistance from someone else.
I’ve been trying to get this last step working but to no avail, but it’s been good trying to work through it myself, will be great to see how you resolve this.
Wow – I can see why this one is giving you so much trouble. It doesn’t look that bad on the face of it, but when you start unwinding the branched measures it gets gnarly in a hurry. This one has turned into a full-scale brawl between me and X-Xbar. I’ve got it up on two screens, with a measure and two DAX queries in progress. It got some shots in early, but I think I’m gaining the upper hand.
Just wanted to let you know that I hadn’t forgotten about it, but it’s just taking longer than expected. Will continue slugging it out until I get a solution for you…
@BrianJ You truly are a top fella, really appreciate your efforts. It is a challenging problem, hopefully you’re enjoying it
I’m looking forward to spending some time over the coming weeks in some DAX learning. My time was gobbled up by watching the Football/Euro 2020 and eDNA challenge 14.
Wow - I think this problem represented the biggest gap I’ve ever encountered between how hard it looked and how hard it ultimately was. This is one of those rare instances where measure branching actually makes things a bit tougher, because I had to trace back 3-4 levels to rewrite measures so that they would pull through the virtual table calculations correctly.
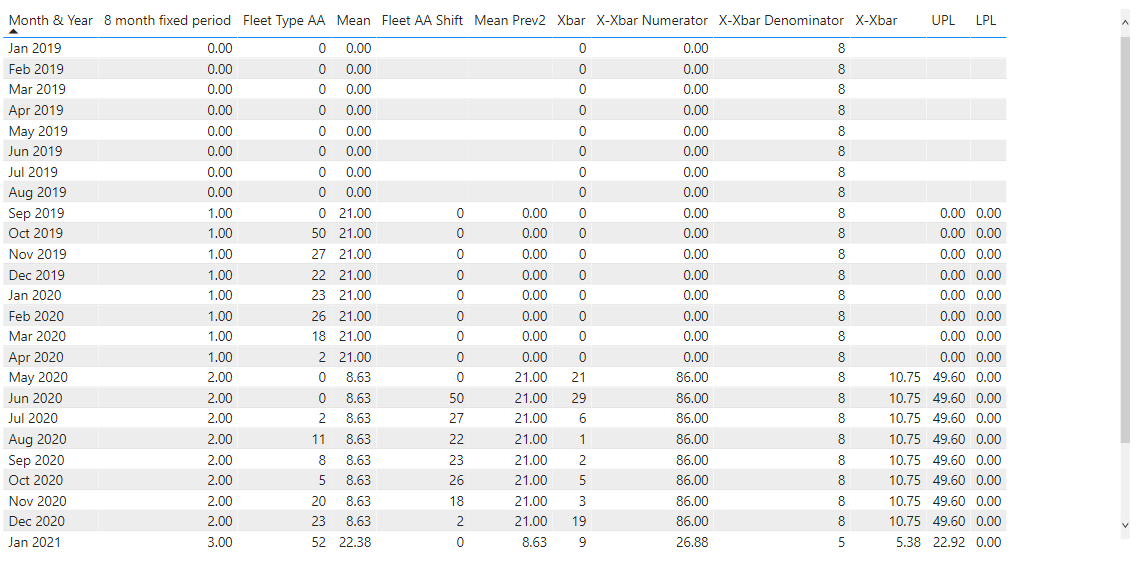
What I ended up having to do was break things down into the simplest possible components – the AVERAGEX computation within the X-Xbar measure was simply too complex for me to comprehend what was going on internally. So, basically what I did was wrote a measure that calculated the mean of the Fleet AA values by eight-month period. Then I had to rewrite the previous mean measure so that it would work correctly within the X-Xbar virtual table. Then I broke the X-Xbar calculation into numerator and denominator, with the final measure just being DIVIDE( _numerator, _denominator, BLANK() ).
I don’t know if you’re using a tool like DAX Studio or TE3, but if not this is the sort of measure where you have absolutely no chance without being able to visualize in a DAX query what’s going on within the virtual tables.
Here’s the final calculations, where I left my interim measures in place just for illustrative purposes – you can take them out of the final visual and X-Xbar still computes properly.
This whole exercise reminded me of the final flight in The Raid: Redemption (arguably the best action movie ever made). The bad guy, Mad Dog, doesn’t look like much but he puts up an incredible flight.
Thanks for the challenge on this one – I enjoyed the hell out of it. Full solution file posted below.
P.S. Awesome job providing the Excel mockup and PBIX and Excel files. Particularly without the mockup, I would have been total sunk on this, since at times I was getting results that looked credible but didn’t square with the validated mockup.
You’re an absolute legend @BrianJ, even more so for referencing The Raid: Redemption (is that The Raid 2? Iko Uwais is amazing, loved The Raid, don’t think I’ve seen the sequel)
I need to start using DAX Studio, I was checking with my boss if we can download it at work as we have some restrictions on downloads etc.
Glad I could help. If you’re going to be working with this level of DAX complexity, DAX Studio and TE3 are mandatory IMO. Even Russo and Ferrari don’t write this type of DAX outside of a DAX query that can be visualized.
The good news is that both programs are available in “portable” versions that don’t require any installation on your computer or network. They’re slightly less convenient since you can’t call them from the External Tools menu and thus you have to connect to your PBIX file manually, but that’s small potatoes compared to not being able to use them at all.
Brian
P.S. Redemption is the first one, although Raid 2 is almost as good. Huge fan of Iko Uwais - he also makes a great bad guy in The Night Comes for Us.
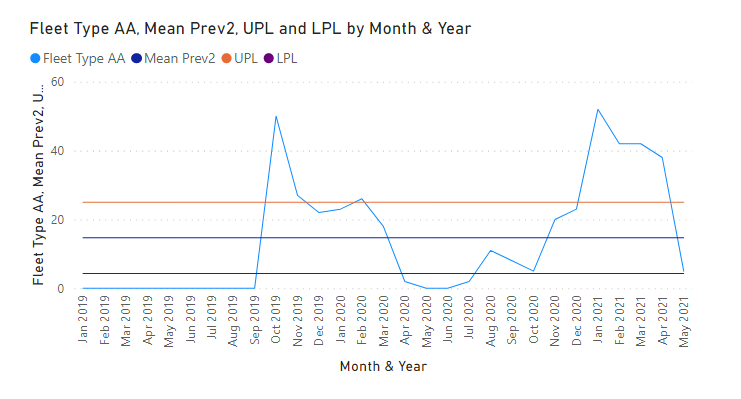
I’m thinking I’ve done something wrong when implementing this solution, I’ve created the UPL & LPL calculations which work fine in the table (which I suspect is due to the table containing the 8 Month Fixed Period…however when I plot it into a graph I don’t get my stepped chart (image at start of thread). I have created a Graph page on the enclosed PBIX.
Apologies for not being clear on my initial post. Let me know if you’d like this in a new post
Happy revisit this one, but I’m swamped over the next day or so prepping for the Power BI Accelerator session. If you wouldn’t mind posting this in a new thread with a link to the old one, that would be great just I don’t lose track of it in a solved thread.
No worries @BrianJ - I’m massively appreciative for all your help on this one. Will post a bit later on today. I’ve not been able to complete the Accelerator 2 model but I’m intending on attending the session.