Gotten really close to having resolved this variation on Standard Deviation
eDNA Forum - X-Xbar Upload 20072021.pbix (159.8 KB)
The calculations are working correctly when placed into a table but not when placed into a line graph which is the ultimate aim. @BrianJ has been a massive help on this and I’ve enclosed the previous thread. belowl
Upper & Lower Limits (A variation on Standard Deviation) - DAX Calculations - Enterprise DNA Forum
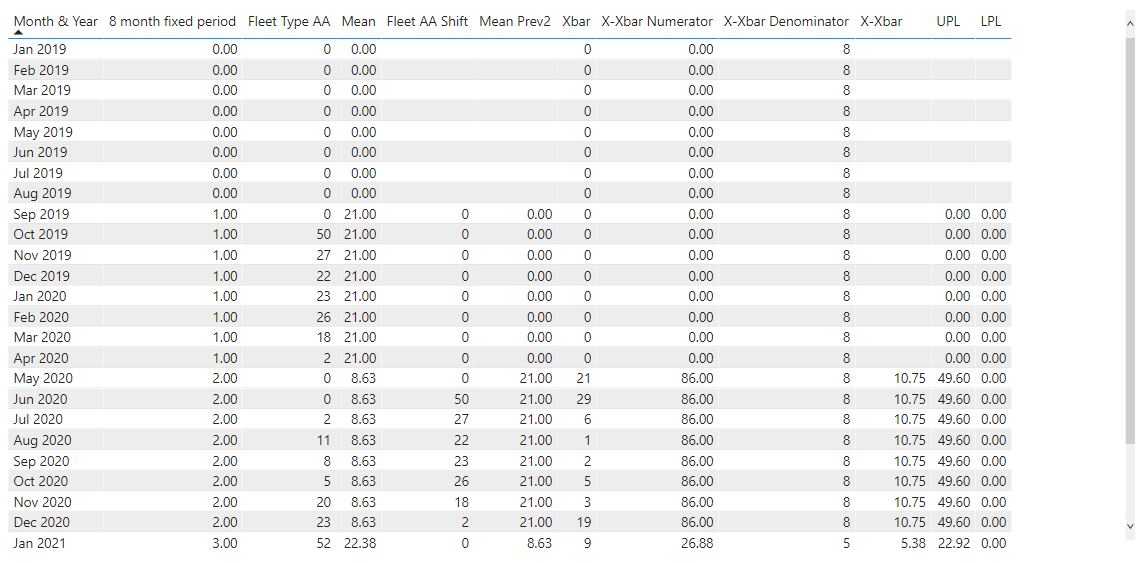
Image below shows the table with the calculations (intermediate calculations are included also)
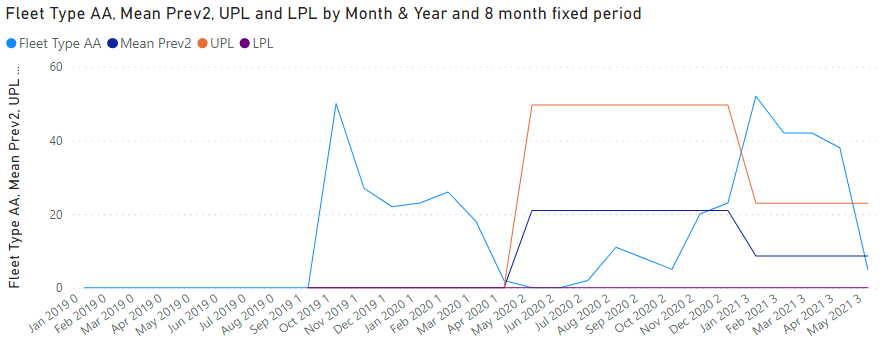
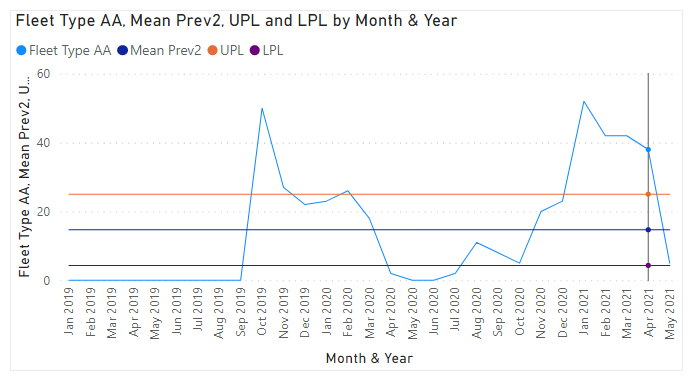
However, when I place them into a line graph the Mean Prev, UPL & LPL are flat and don’t follow the changes as they do in the table (previous image)
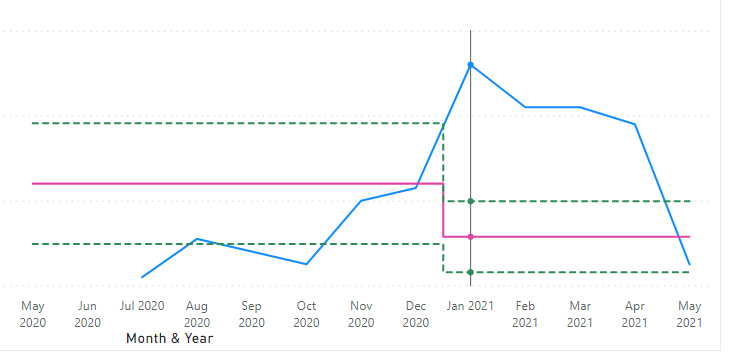
I’m looking to get the stepped layout as per below (The image below is an example and not using the same numbers)
David