Welcome to the 10th instalment of the Enterprise DNA problem of the week.
Time is something that can cause a few hiccups in Power BI and isn’t always the easiest to manage, however the number of use cases spans across many industries and scenarios.
A great technique to be able to call upon and use in your development.
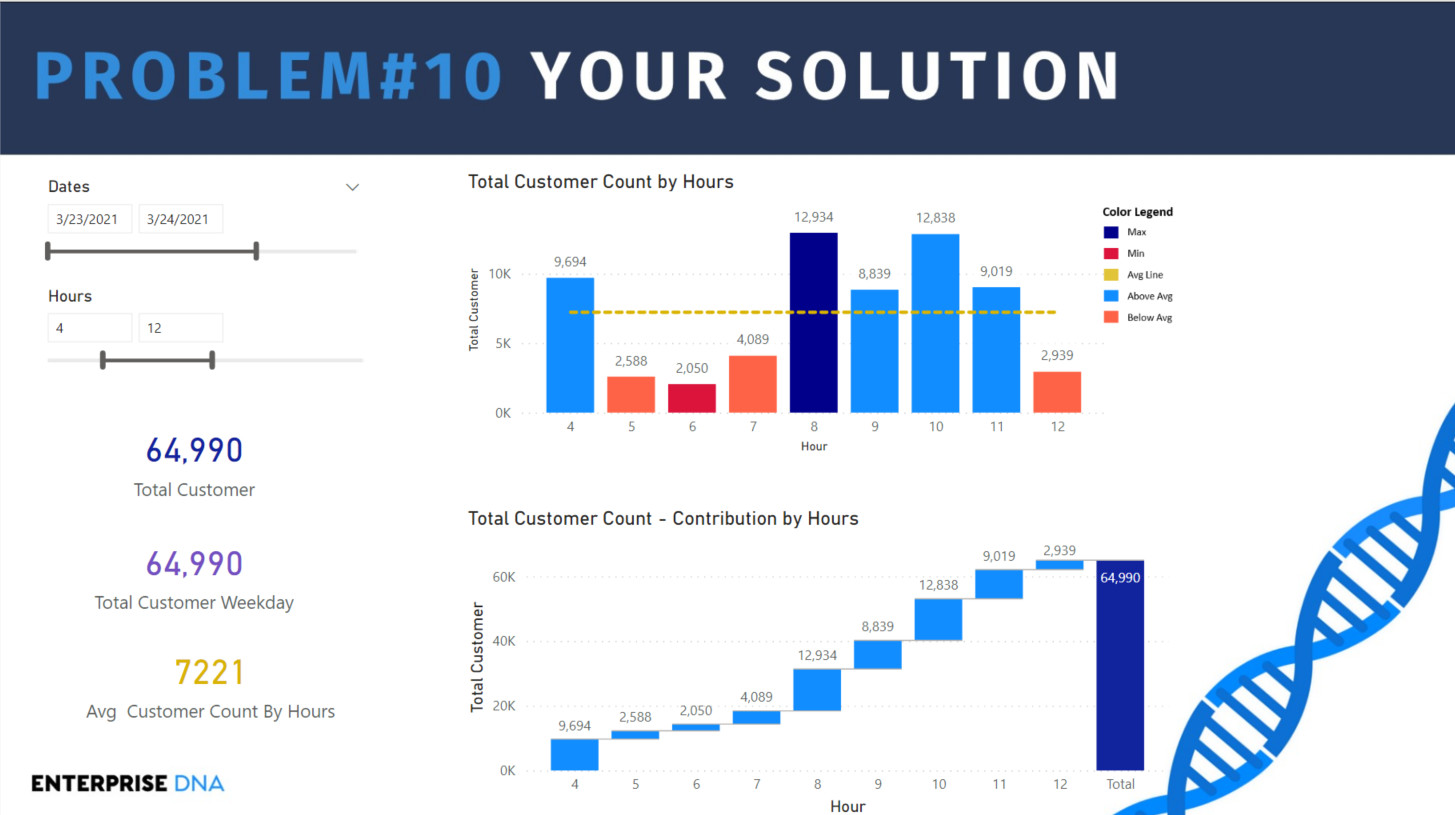
The ask this week is to calculate the number of customers between a specific date period and also define a start time and end time for the selected date period.
This is a DAX only challenge and the model is super simple as its all about focussing on the technique required.
Please find attached the PBIX file.
Any questions or clarifications do not hesitate to get in touch.
If you’ve been hesitant to jump into participating in Problem of the Week, this is a great week to start. It’s an immensely practical problem that will add some valuable tools to your toolbox, and shouldn’t take too long to complete.
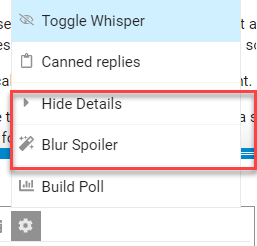
Finally a reminder to use the Hide Details or Blur Spoilers options when posting anything specific about your solution.
As always, thanks to Haroon for leading this week’s problem, and to all of you for participating in what we think is a really worthwhile community learning initiative.
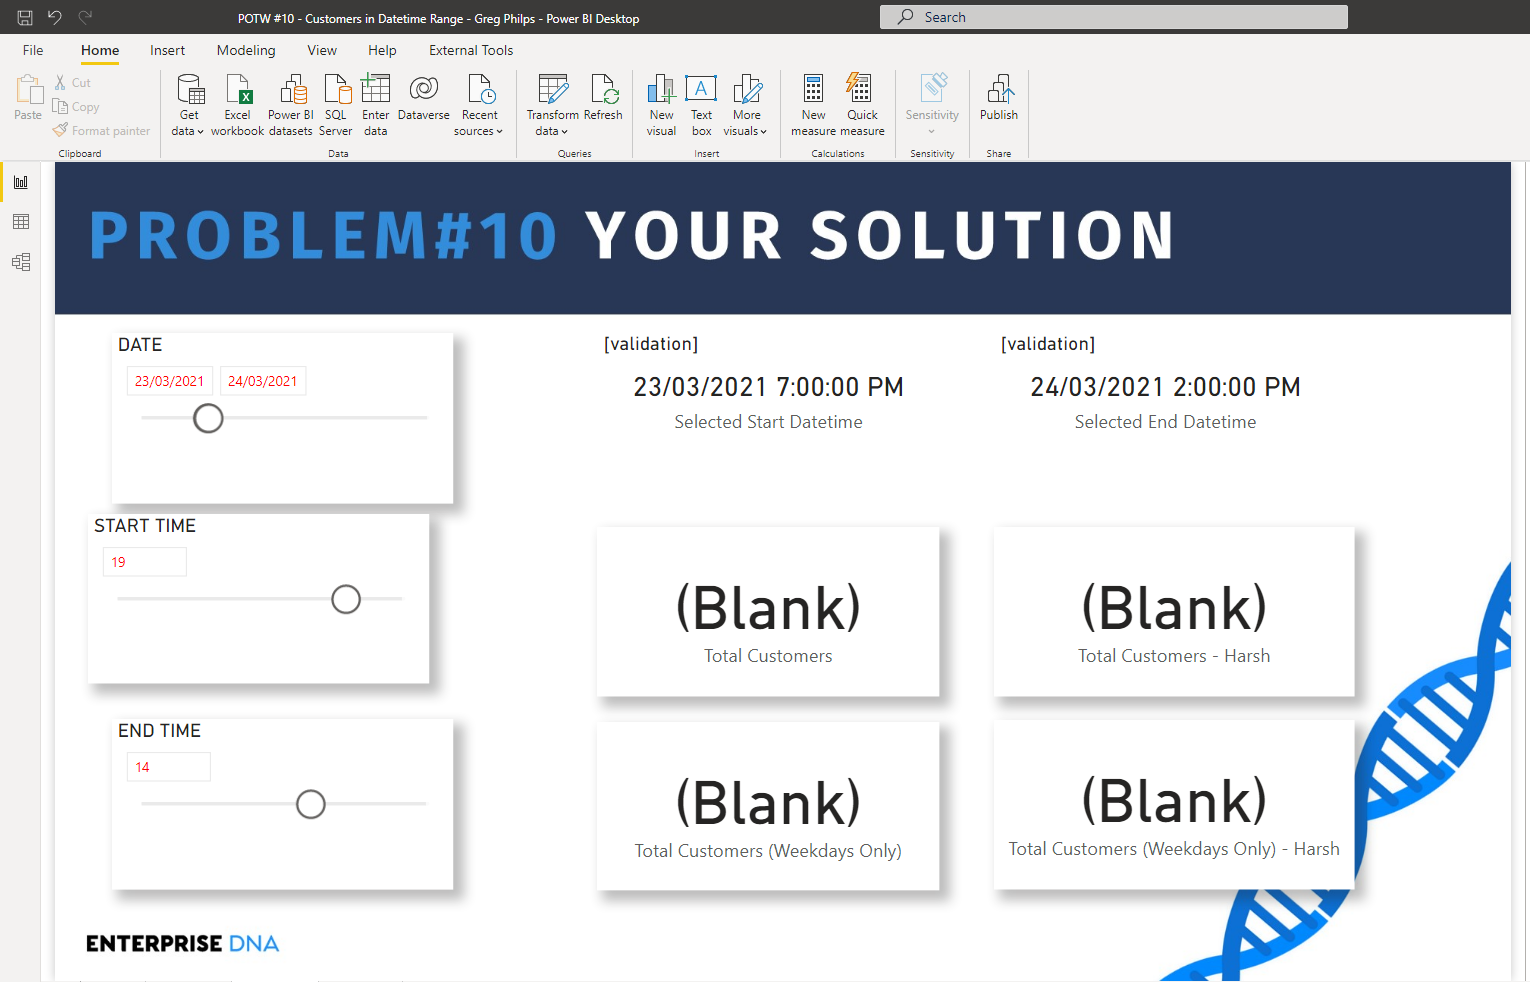
transformed data for [Dates] table, used “Choose Columns” to keep only [Date], [DayOfWeekName], and [IsWorkingDay] columns
added slicer for Dates[Date]
turned off selection header
turned on title and set title to “DATE”
set “Date Inputs” font colour to #FF0000 (red)
added what-if parameter for “Start Time” (0-24, step 1)
turned off selection header
turned on title and set title to “START TIME”
set “Numeric Inputs” font colour to #FF0000 (red)
added what-if parameter for “End Time” (0-24, step 1)
turned off selection header
turned on title and set title to “END TIME”
set “Numeric Inputs” font colour to #FF0000 (red)
added [Key Measures] table
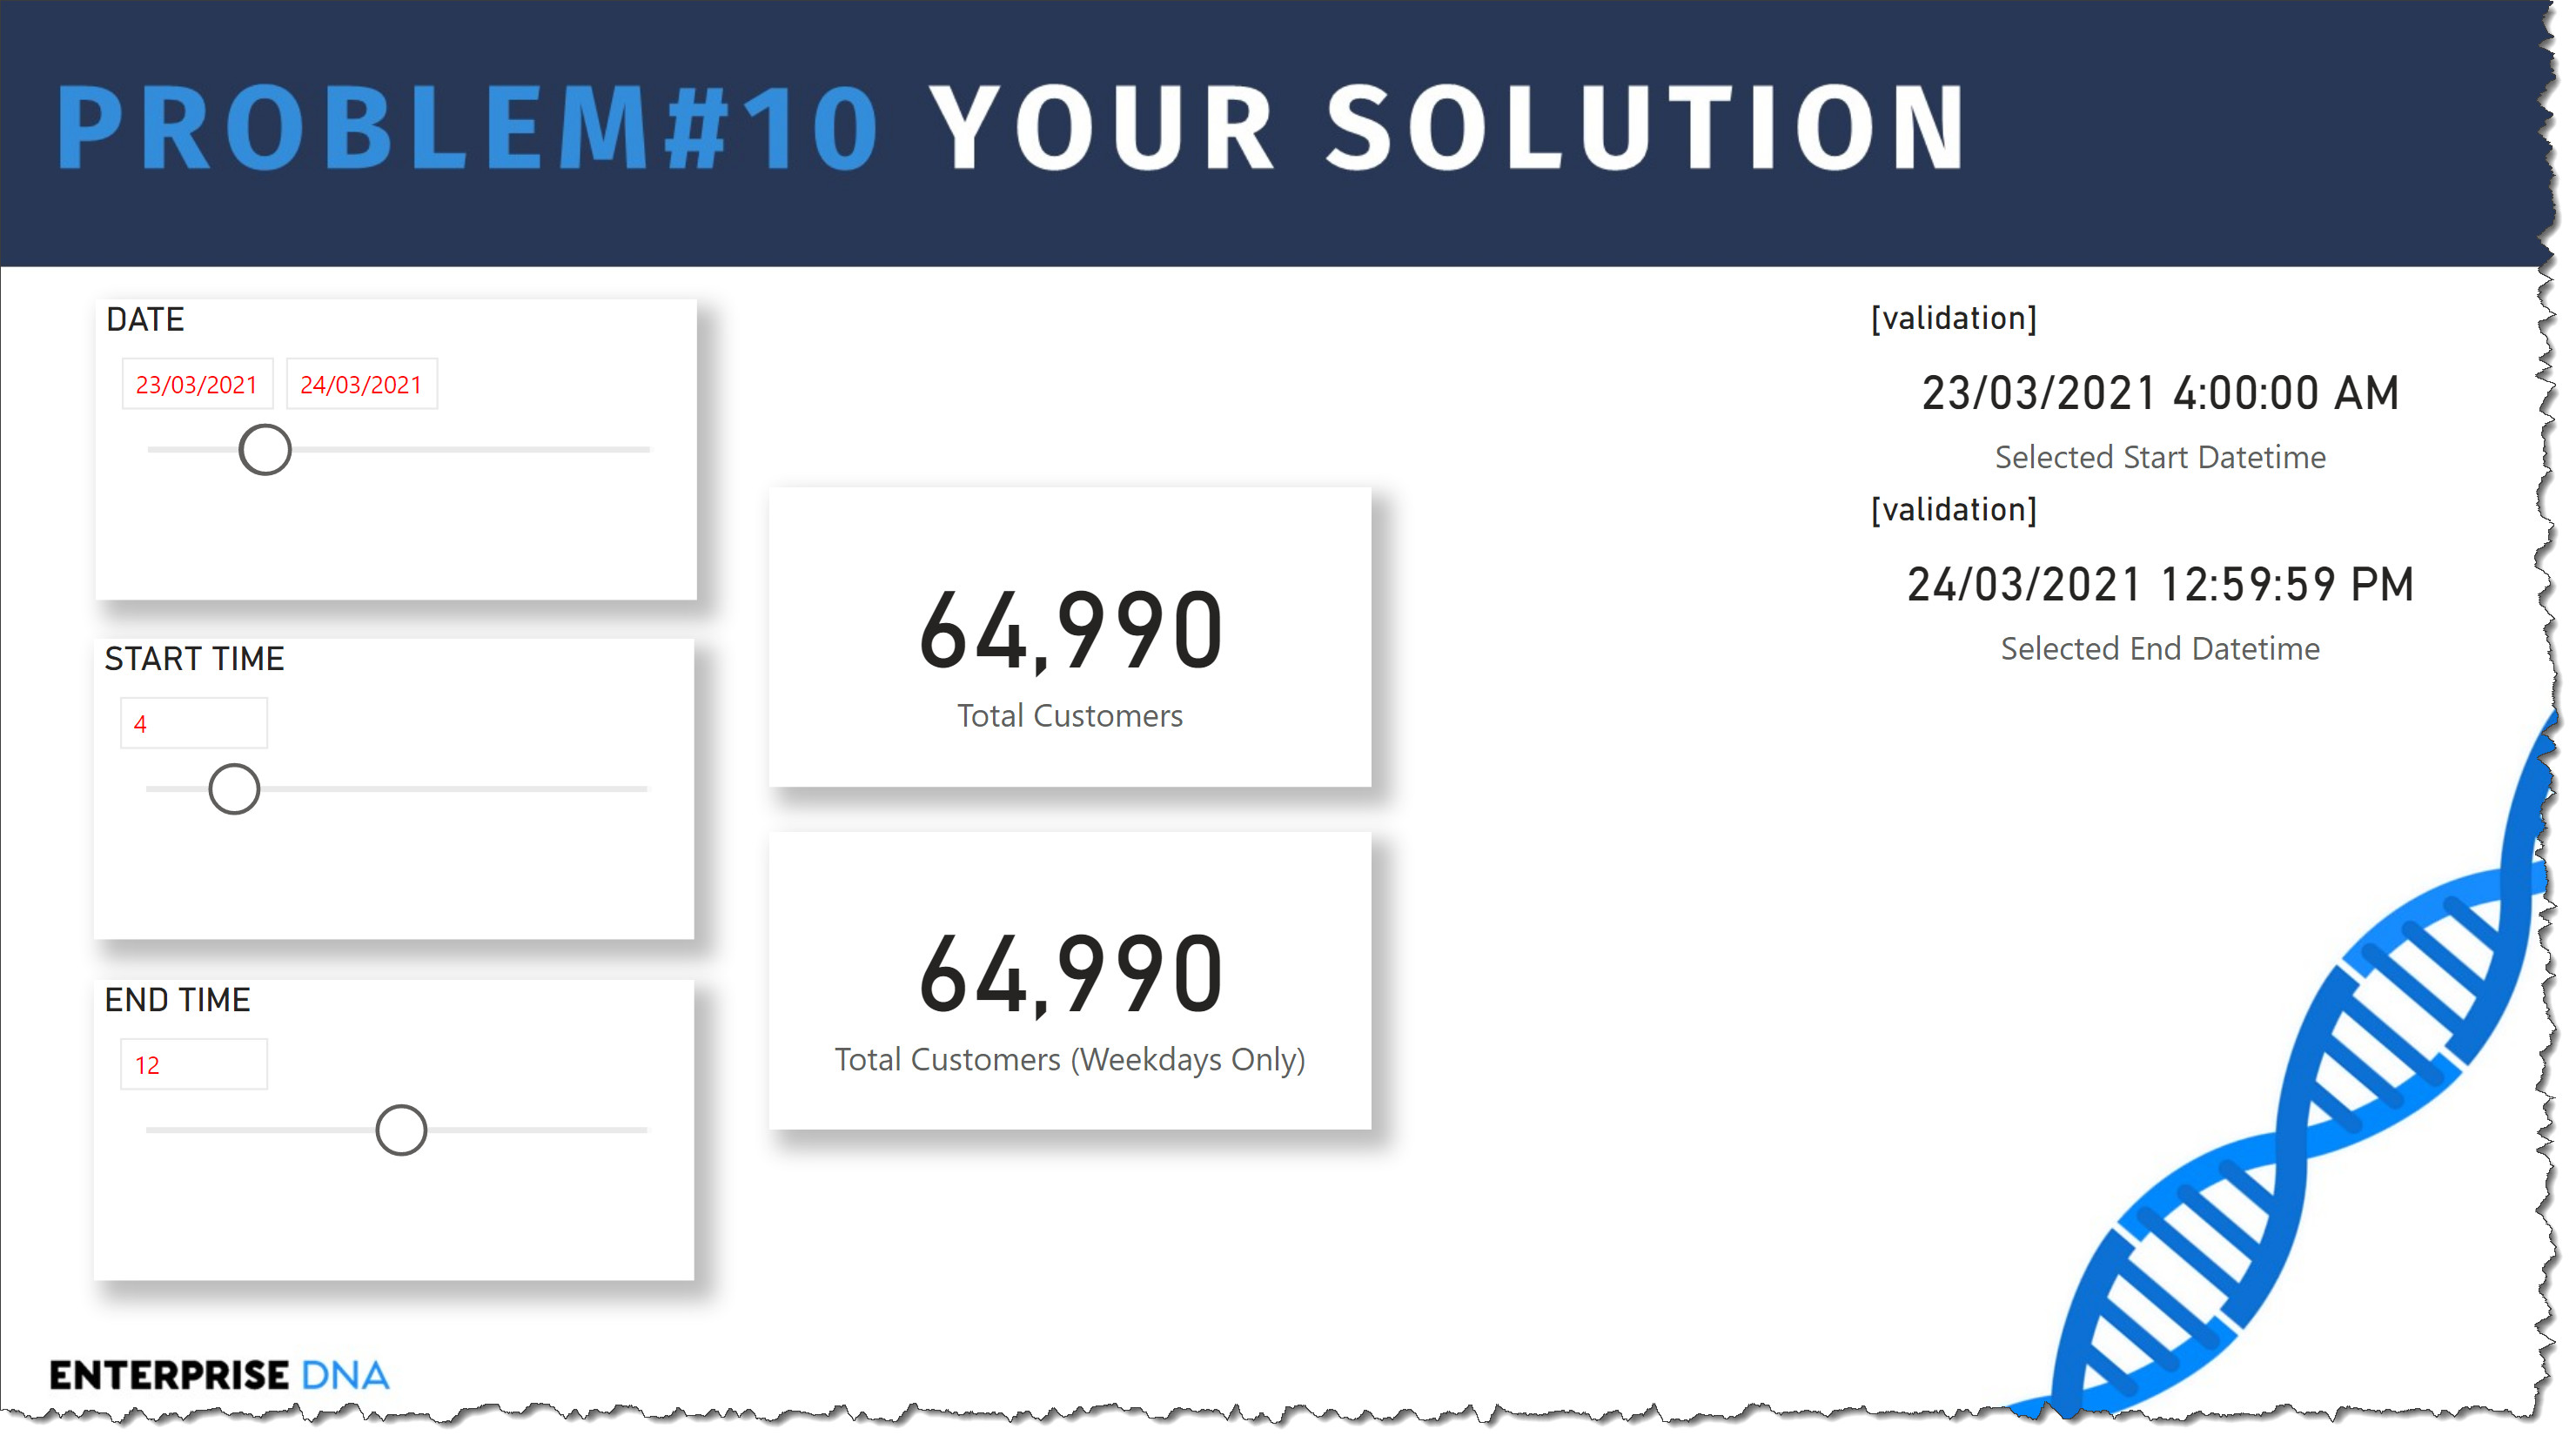
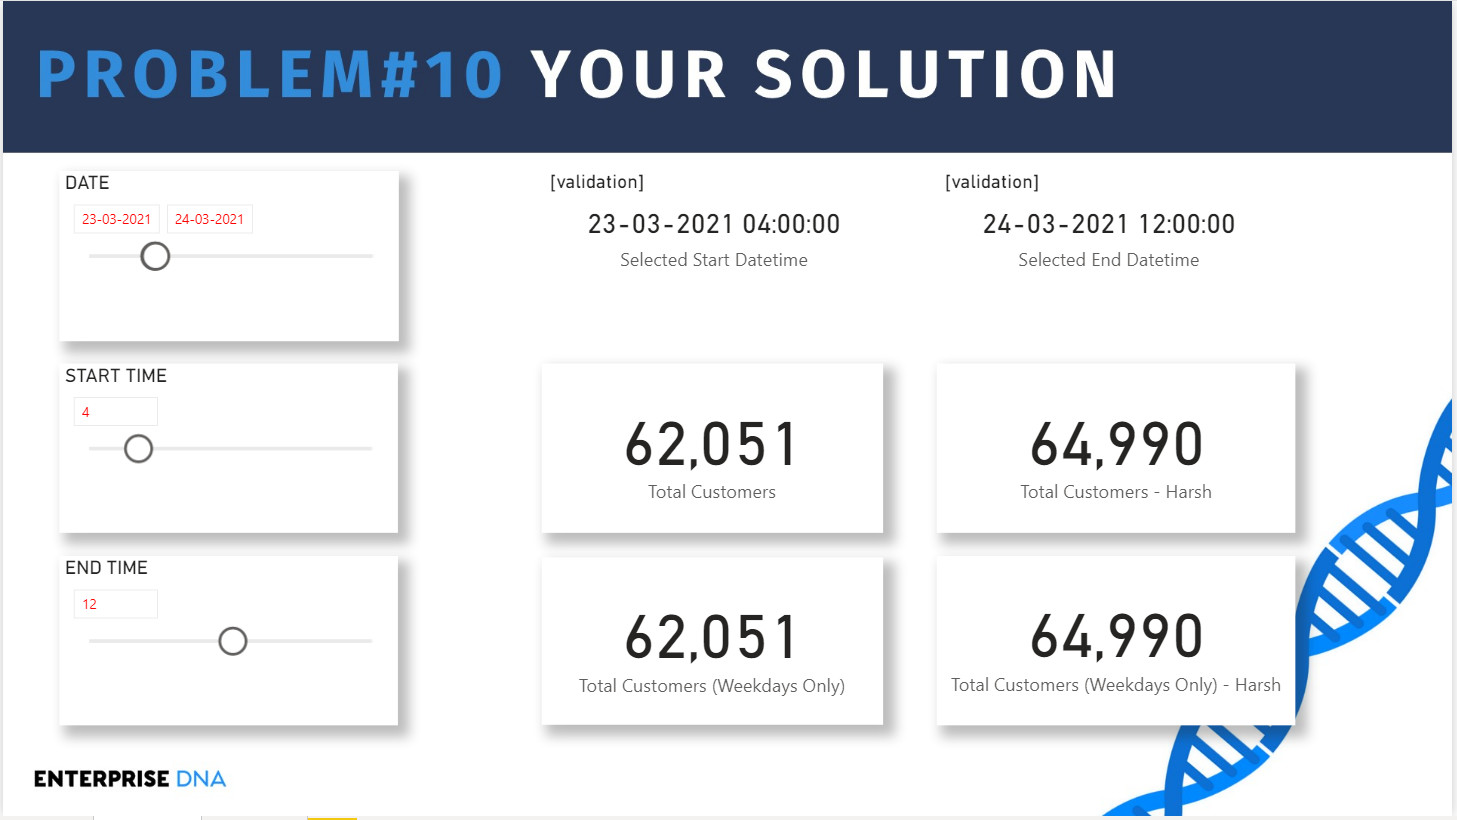
added [Selected Start Datetime] measure
added [Selected End Datetime] measure
changed datatype of “Fact Customer Count[StartDateTime]” column from TEXT to DATETIME
added [Total Customers] measure
added Card to display [Total Customers] measure
added [Total Customers (Weekdays Only)] measure
added Card to display [Total Customers (Weekdays Only)] measure
Edit:
updated the logic in my [Selected End DateTime] measure to calculate hh:59:59 instead of my first try where I mistakenly used hh:00:00; now my results agree with @Harsh and @jbressan; updated my screenshot and PBIX
Selected End Datetime =
VAR _SelectedDate = MAX( Dates[Date] )
VAR _SelectedEndHour = SELECTEDVALUE( 'End Time'[End Time] )
VAR _SelectedTime = TIME( _SelectedEndHour, 59, 59 )
VAR _Result = _SelectedDate + _SelectedTime

RETURN
_Result
FINDINGS
there is data only for March 23-March 25, all of which are weekdays, so both “Total Customer…” measures return the same result in all cases
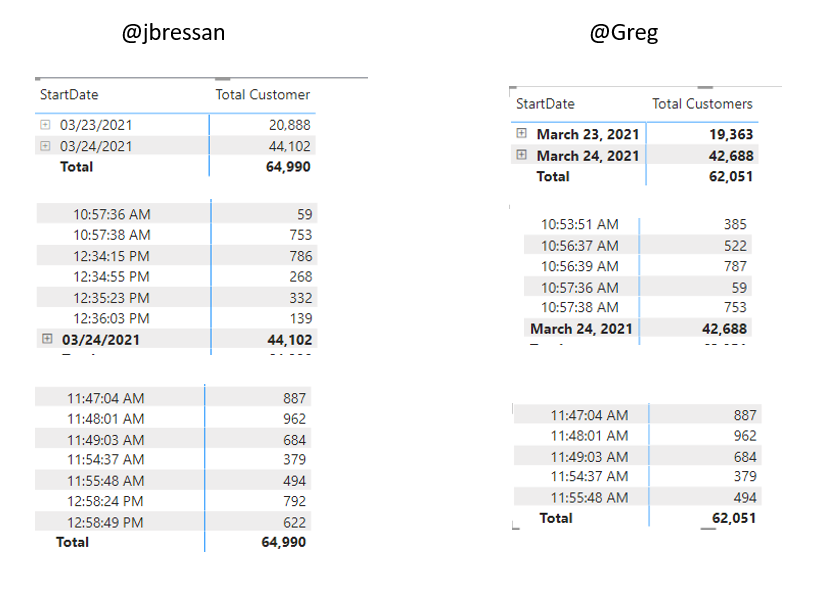
after I finished development, I looked at the screenshots (not the PBIXs) for @Harsh’s and @jbressan’s submissions, and saw that I have different (lower) numbers; I used what-if parameters for start and end time instead on the supplied [Time Table] table, so am guessing that may be the difference
as it turns out, I was in error as I was using hh:00:00 for an end time instead of hh_59:59; once fixed, my results agreed with @Harsh and @jbressan
I can’t stress how much my use of (always hidden, but I think I forgot this time) [Validation] pages help me to verify calculations and uncover issues; highly recommended
Really liked your approach. Saw something new here.
Summary
The reason why there was a difference between our numbers is becasue of the following reasons -
1. You divided the “Start Time” and “End Time” by 24 whereas in my case I considered them as a whole, that is, as it is.
2. You compared “StartDateTime” from the fact table with the “Start Date and Time” (measure) and “End Date and Time” measure whereas in my case I let the relationship took care of it.
3. Lastly, this simple measure would have done the trick here and matched our numbers -
Also attaching the working PBIX file just for the reference purpose.
Lastly, really liked your explanation on “Notes” and “Key Findings”. In the morning, when I uploaded the solution I also observed the same thing in terms of nature of the data and that’s why I also uploaded my cross-verification Excel file. So really spot on over there from you.
Hello!
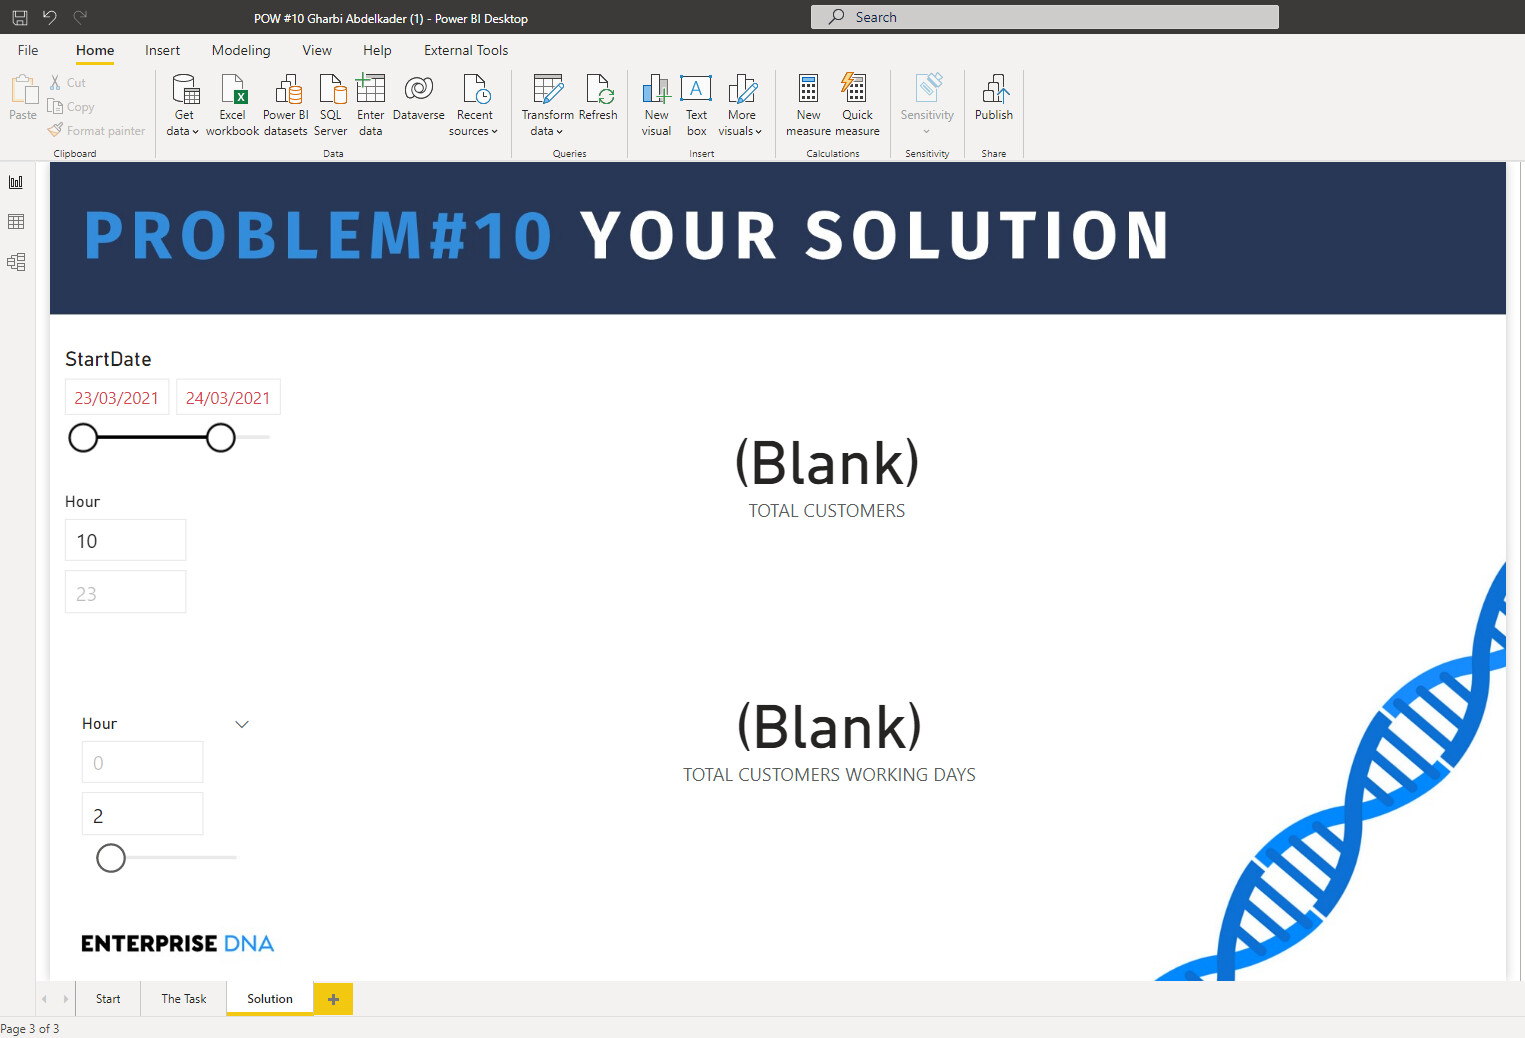
Here goes my solution for challenge number 10.
Spoiler
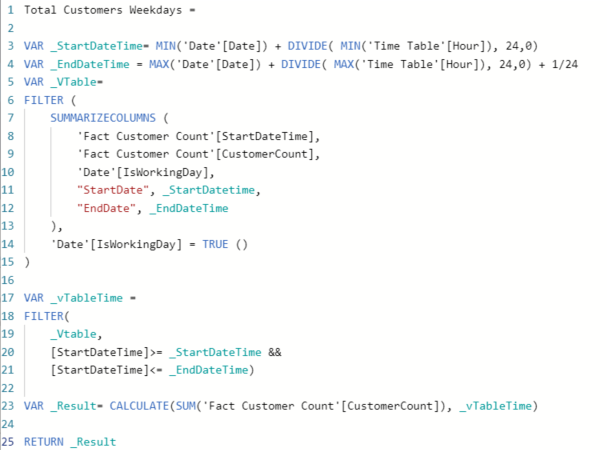
I used variables to advance & check along the way
I computed a min & max date time and added 1/24 as I wanted to include the customers for the Endtime hour selected.
I than created a virtual table to keep only the data I need and filter only the week days. A second variable takes into consideration the time interval.
I trust you are keeping well and safe in these testing times.
A massive thank you to all of you who participated in Problem of the week #10.
As you will be able to testify the problem itself was on the easier side of the scale compared to some of the problems we’ve hosted in recent weeks.
Nonetheless there were some great entries across the board and some fantastic opportunities to learn from others. I definitely picked up a few things and even went down a little rabbit hole with Brian that I still don’t think I fully understood but that’s for another day.
This is a likely to be a very common pattern used in industry when end users want to specify start times and end times for particular periods.
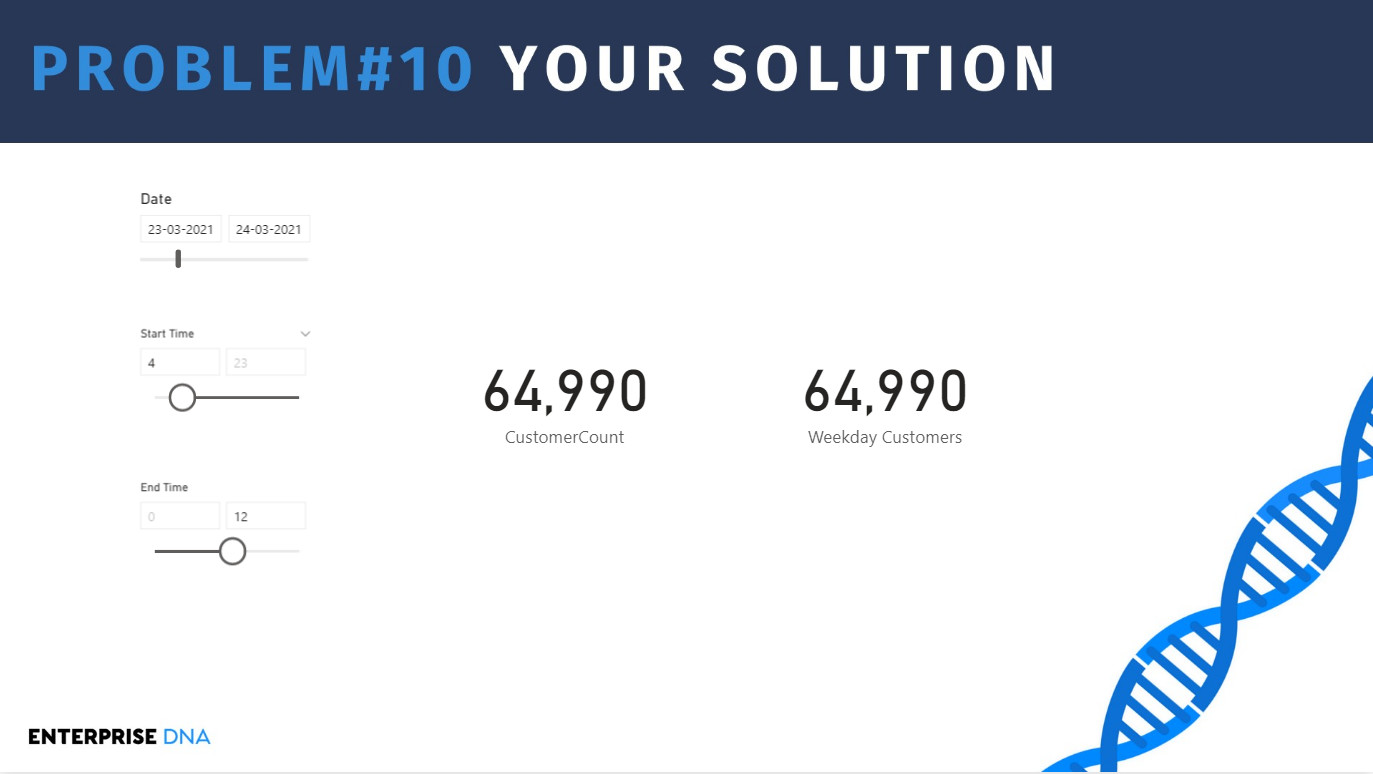
Here is how I tackled this problem:
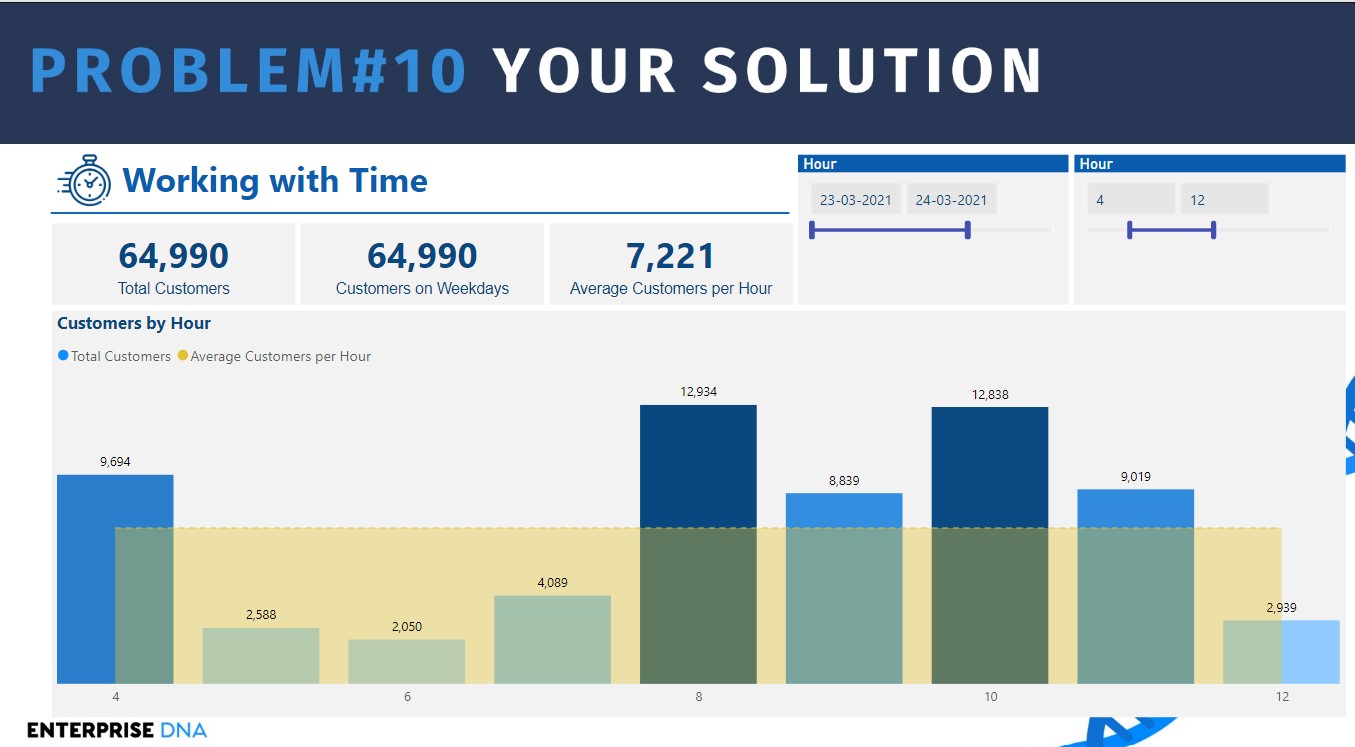
Step 1: Creating support table for the start time and end time. I just used the generate series function.
Step 2: A simple sum to get the total customers.
Step 3: Created a calculation considering the disconnected tables and harvest the selections into the calculation. Giving me the customers based on the date and time period selected.
Step 4: Creating a second measure but this time add the filter for weekday. Measure branched from the measure above and added a filter from the date table for weekday.
In general all entrants tackled the problem with the same high-level principles however there were some great intricacies in the implementations, and I would definitely check out the solutions posted in the forum.
Short and sweet .
Thanks all again for participating and thanks @BrianJ for hosting
I don’t understand why we should use variables to select dates and times, I mean if we have good data model
we just need to add filter in the report (filter for days and filters for hour) write simple formula: sum (column count of customers)
and let filter context does the rest of the job
and for weekday using calculate to add the condition
thanks


")