Enterprise DNA Forum
Power BI Challenge 10- Supplier Insight
Challenges
Supplier Insights
alexbadiu
December 13, 2020, 10:58am
52
Hello all! Please find below my submission for Challenge N 10 Supplier Insight
(Click to unblur!)
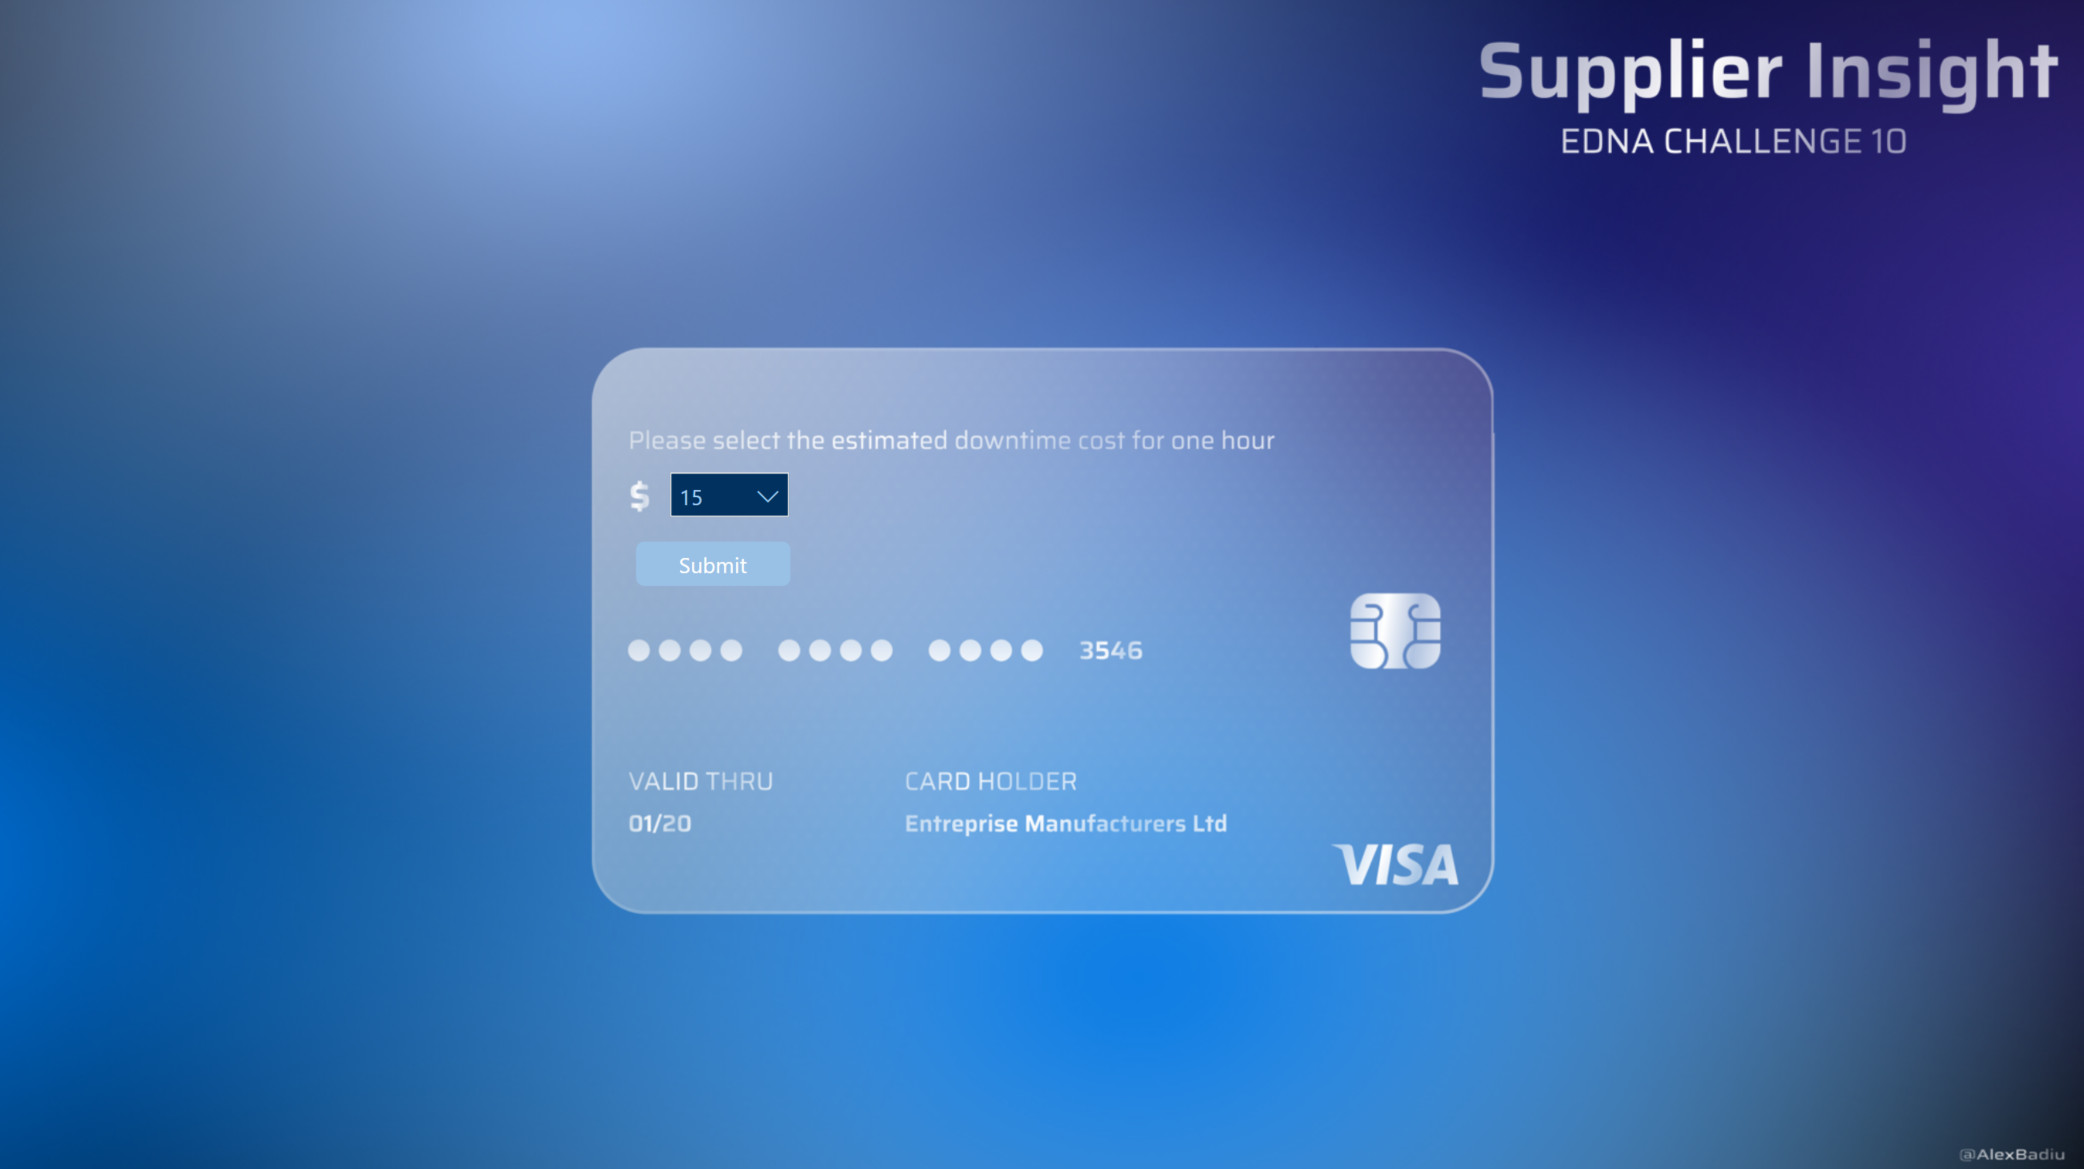
Intro Page
2084×1169 151 KB
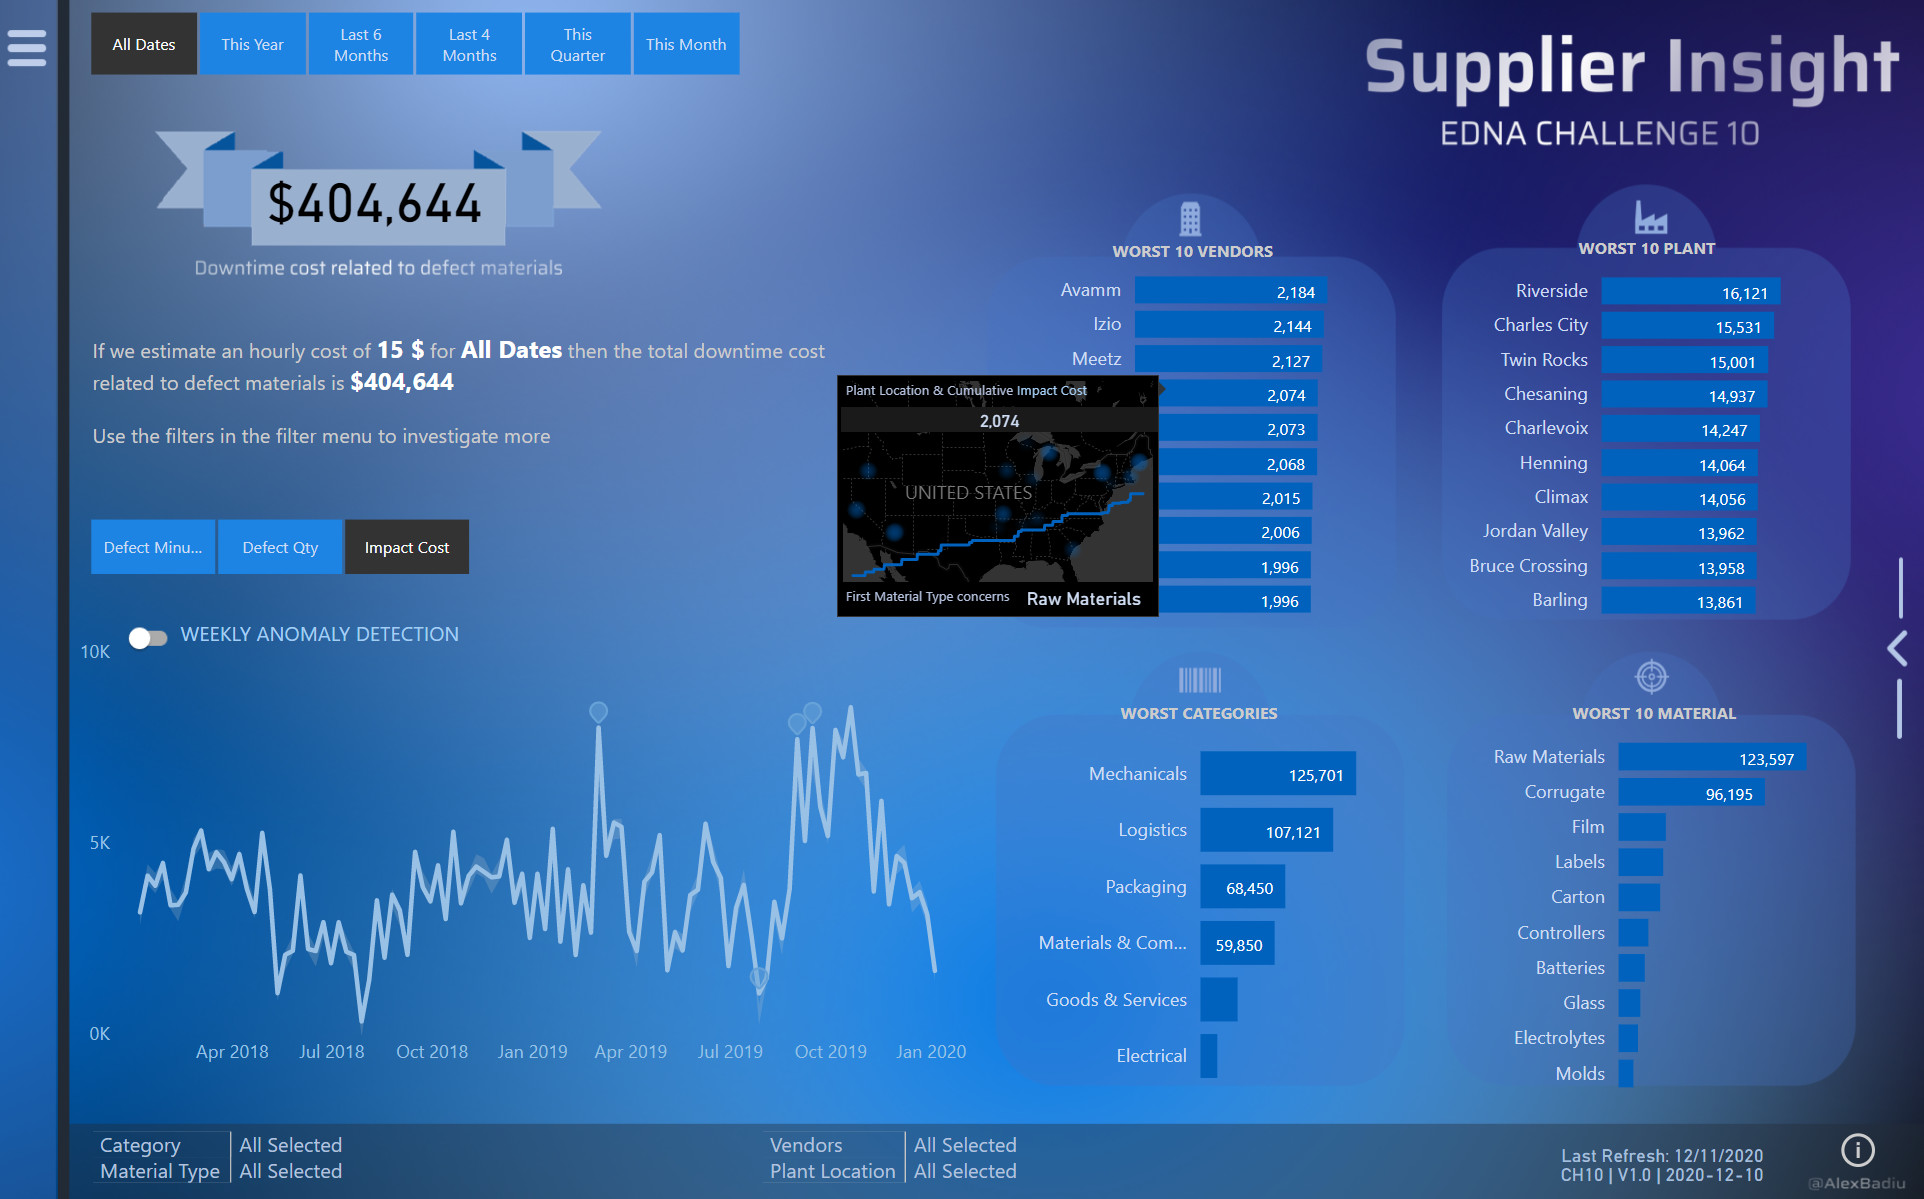
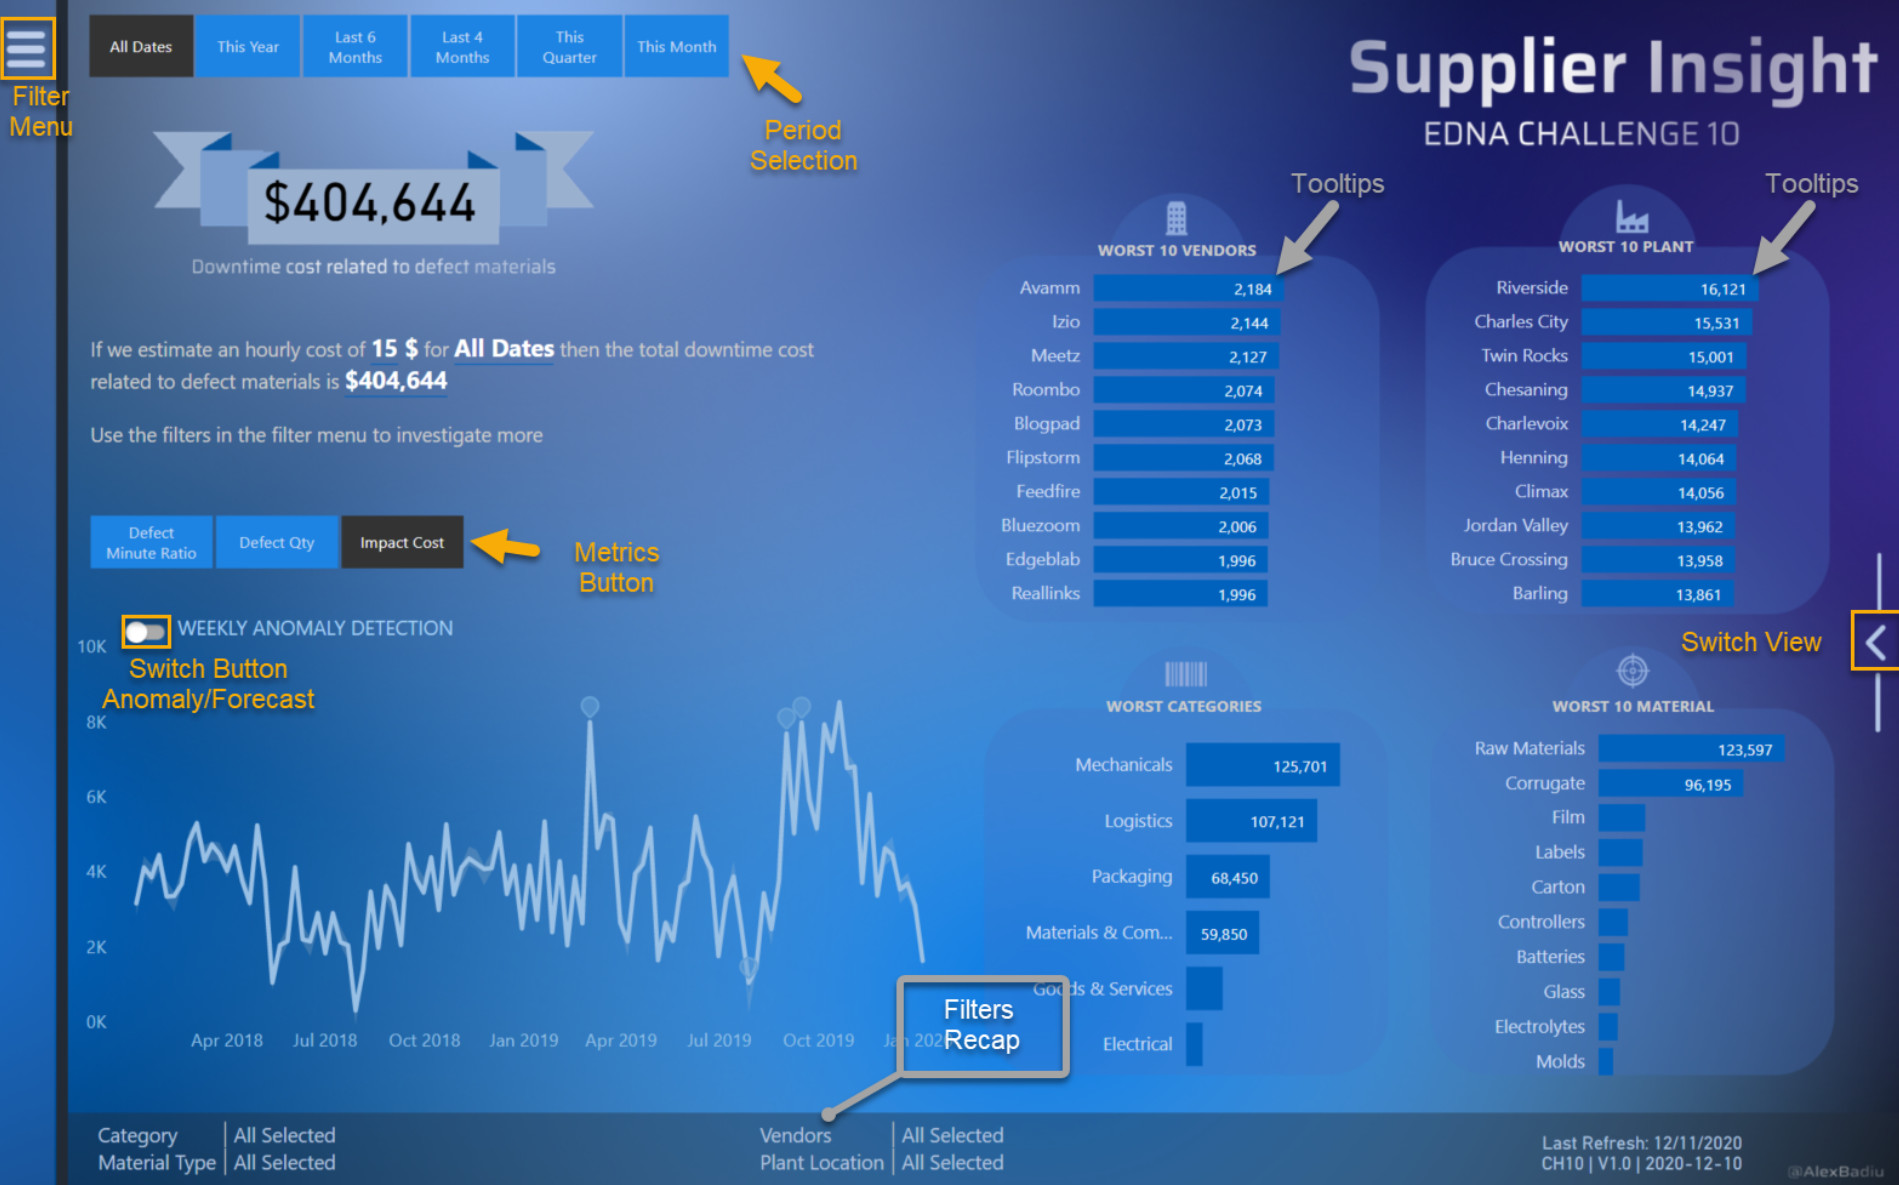
Main Page 1 Tooltip 1
1924×1199 382 KB
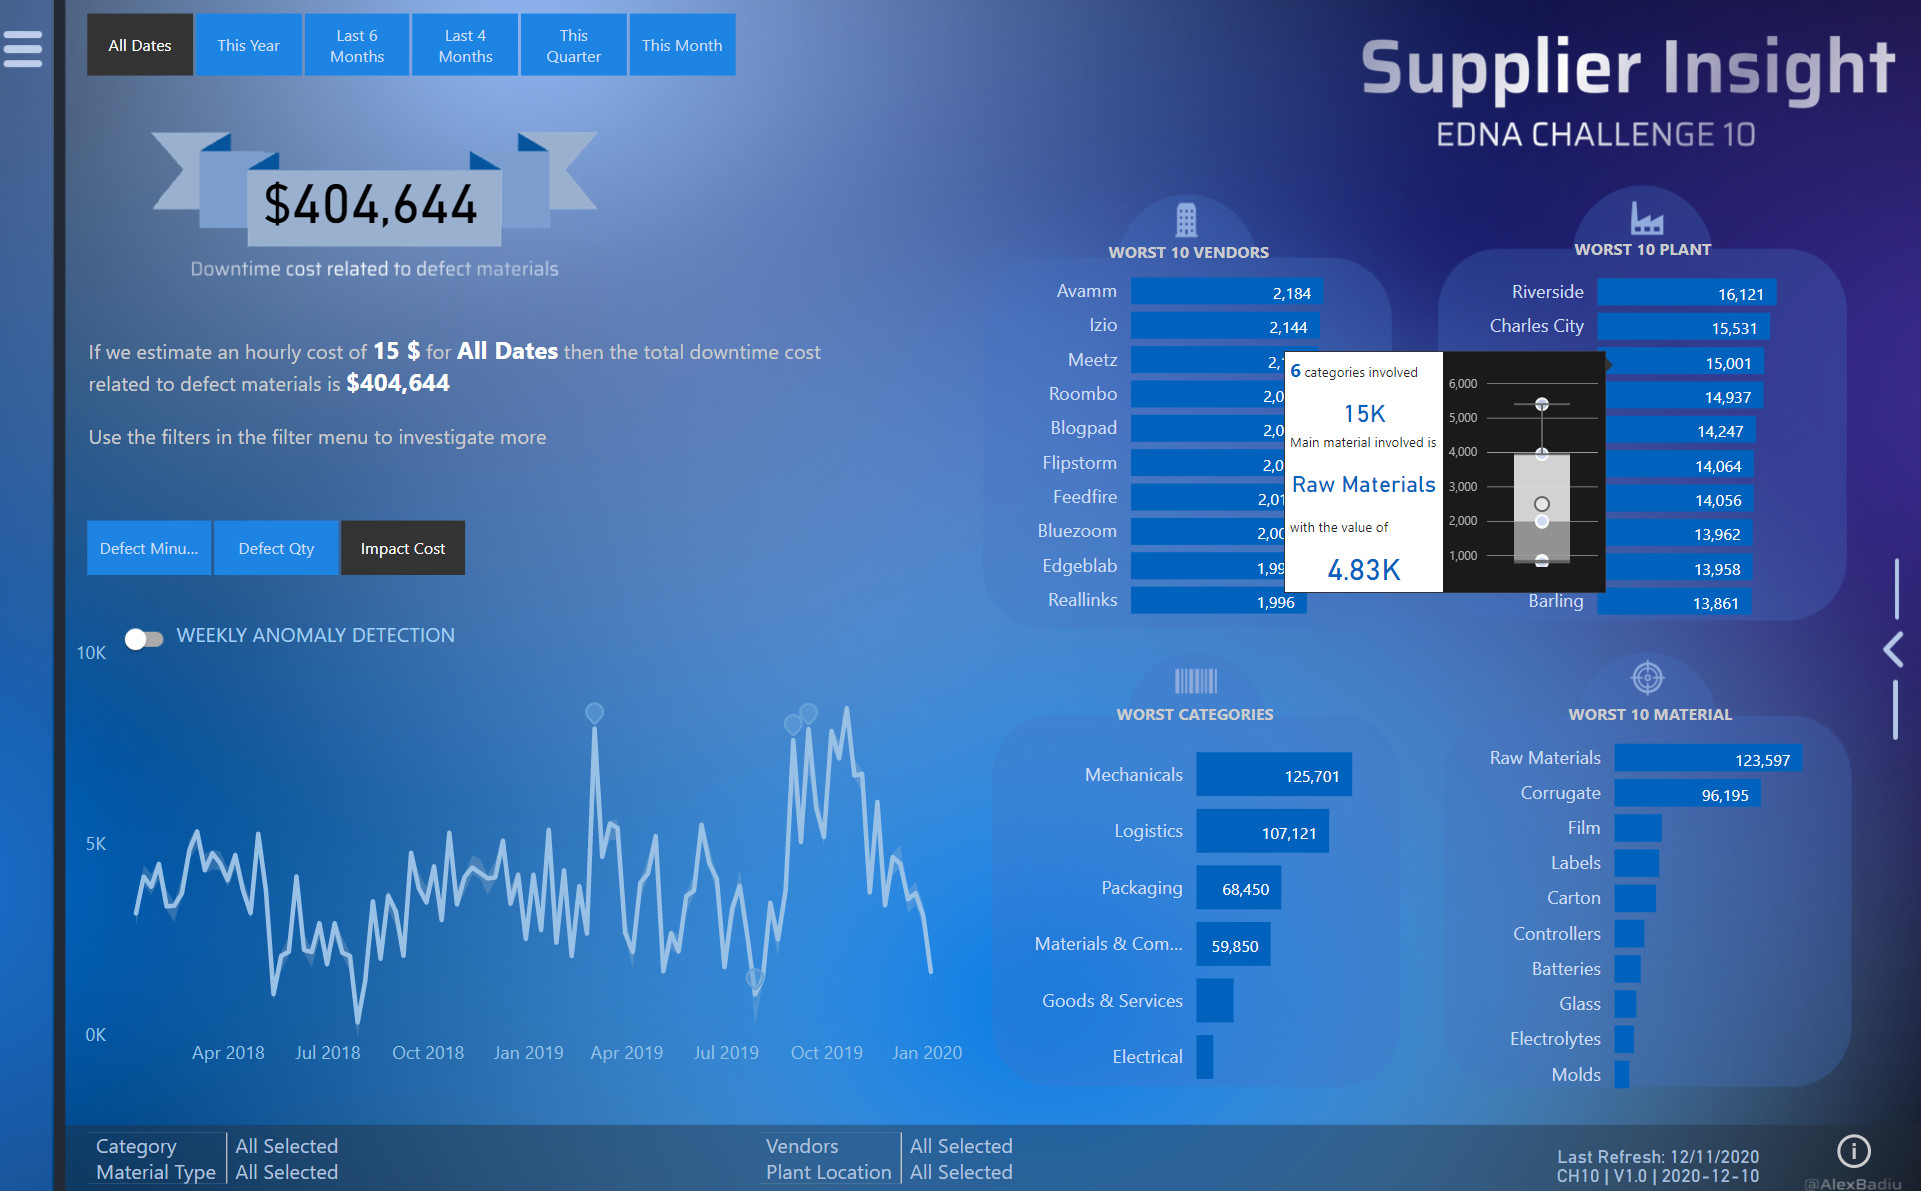
Main Page Tooltip 2
1921×1191 373 KB
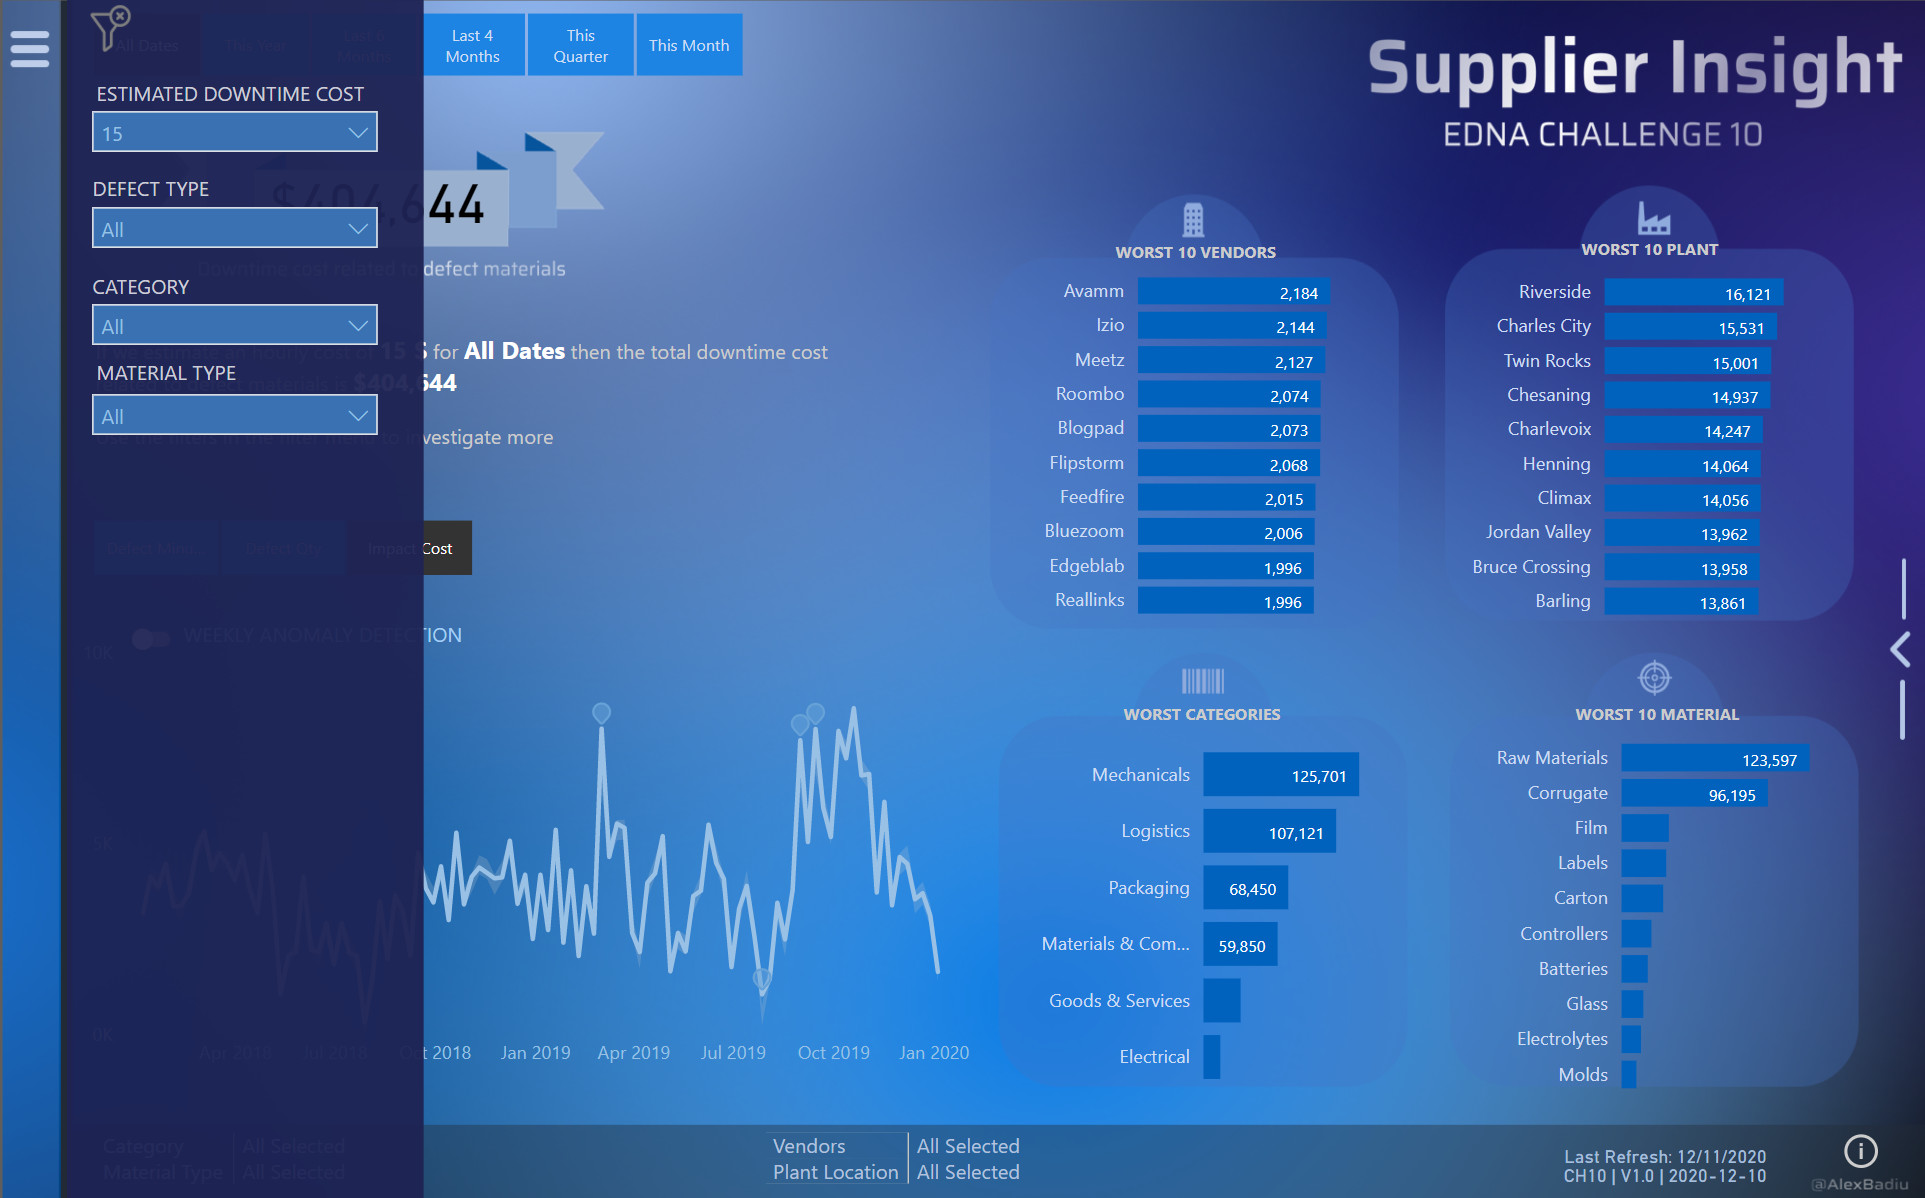
Menu
1925×1198 336 KB
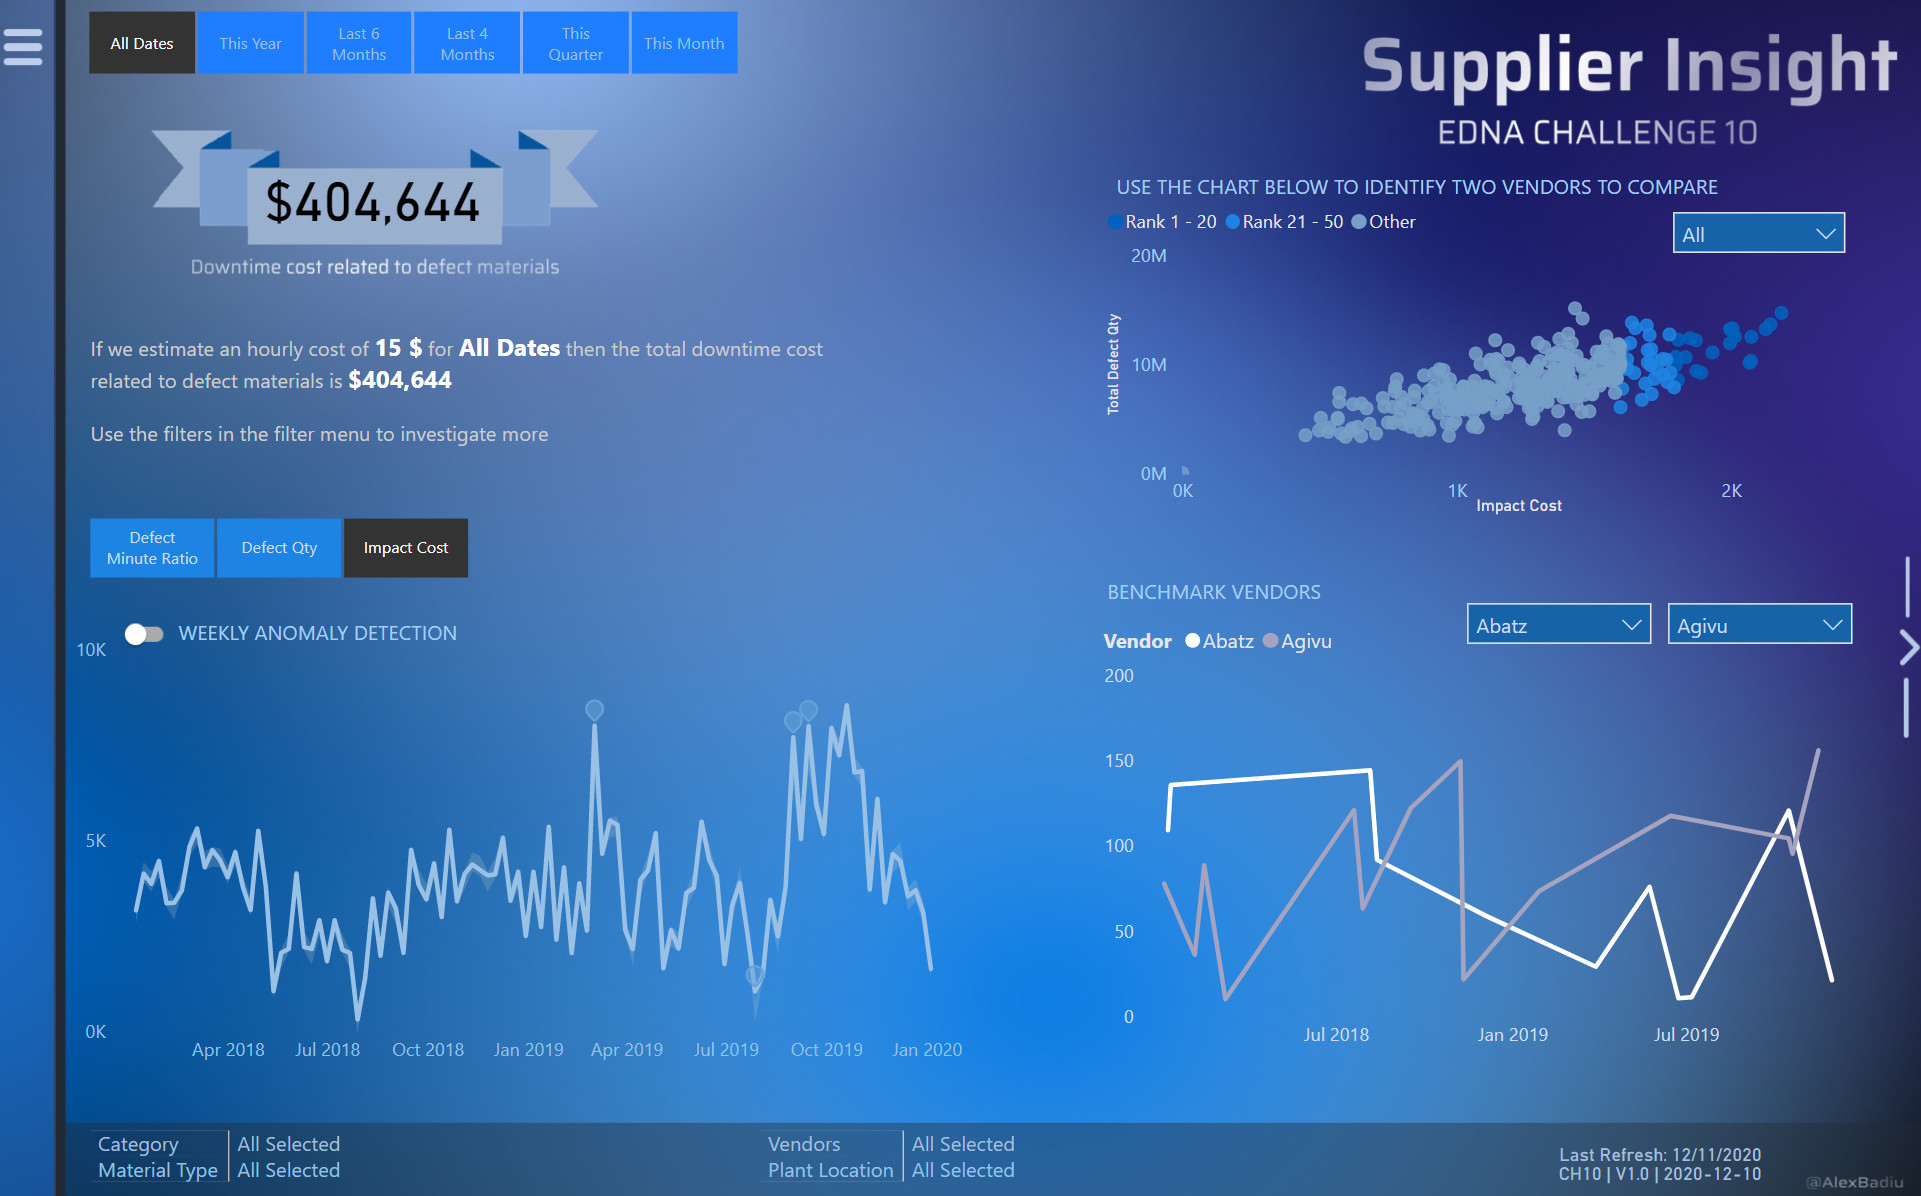
Main Page 2
1921×1196 327 KB
Info Page
1899×1185 329 KB
10 Likes
Power BI Challenge 10 - Supplier Insight from Alex
show post in topic