Excel Workout 11 - Moving Average Forecast

Welcome to Excel Workout #11!
Difficulty Level:
image

This week’s challenge is designed to test your knowledge on Moving Average Forecast and building Line Chart.

Moving Average
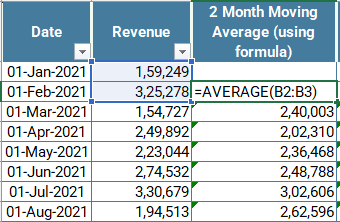
A Moving Average is calculated by taking the average of a specific number of data points in a data set. The data points are selected based on a sliding window, which moves over the data set with each calculation. This sliding window allows the calculation to account for changes in the data over time.

Goals
Please follow the directions given below, which include downloading the Excel worksheet required to perform the challenge tasks. Once you have completed the download, proceed to take the challenge and test your skills.

Task

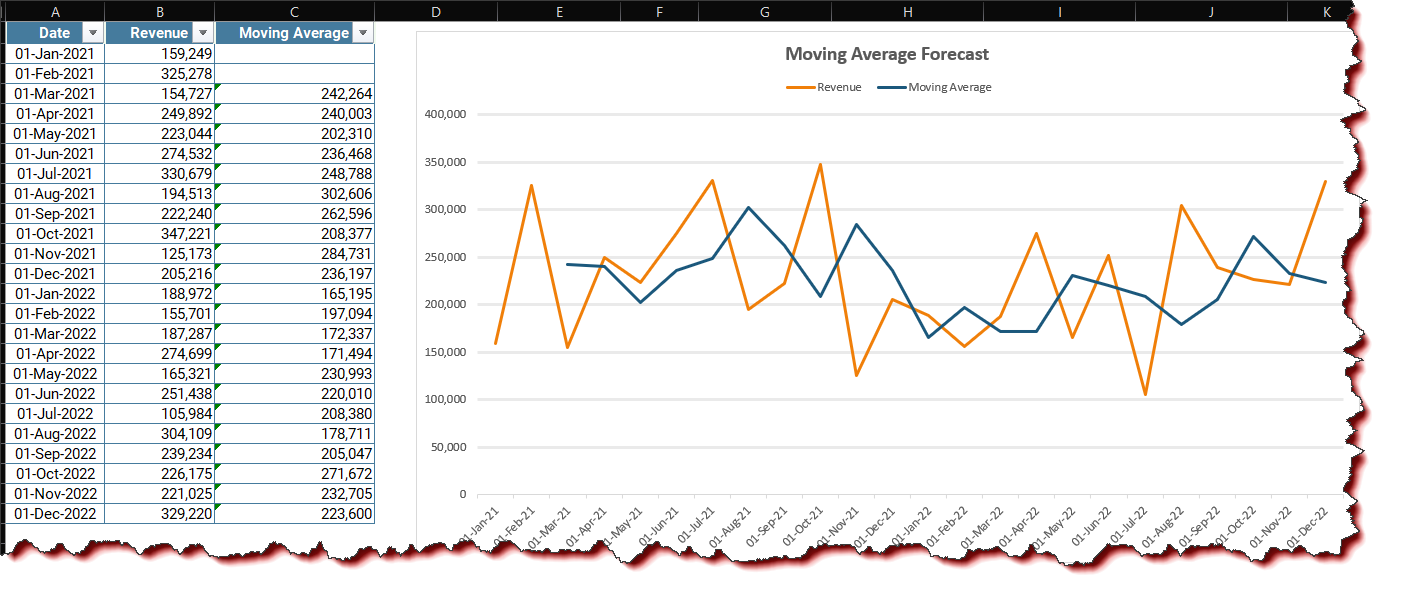
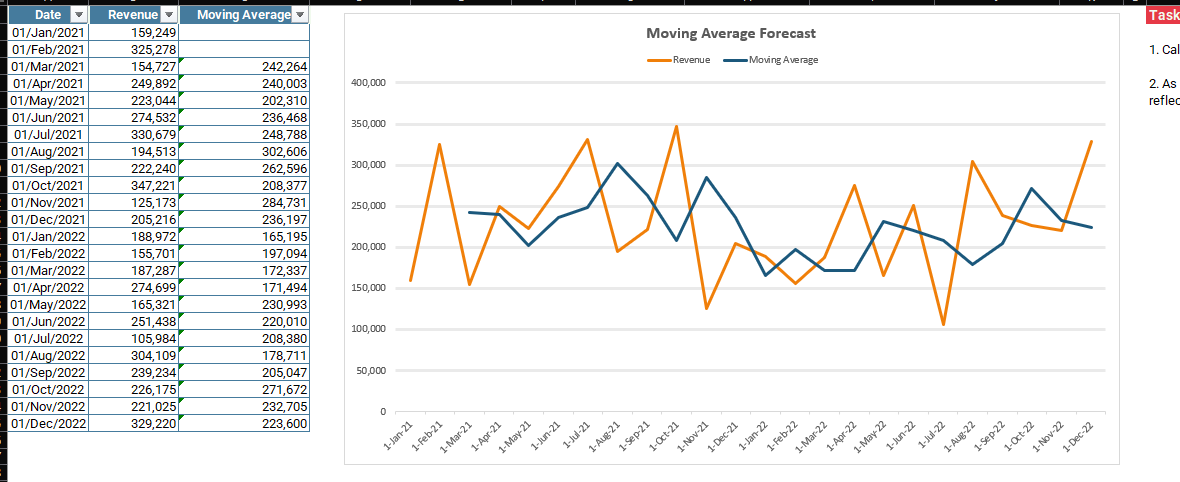
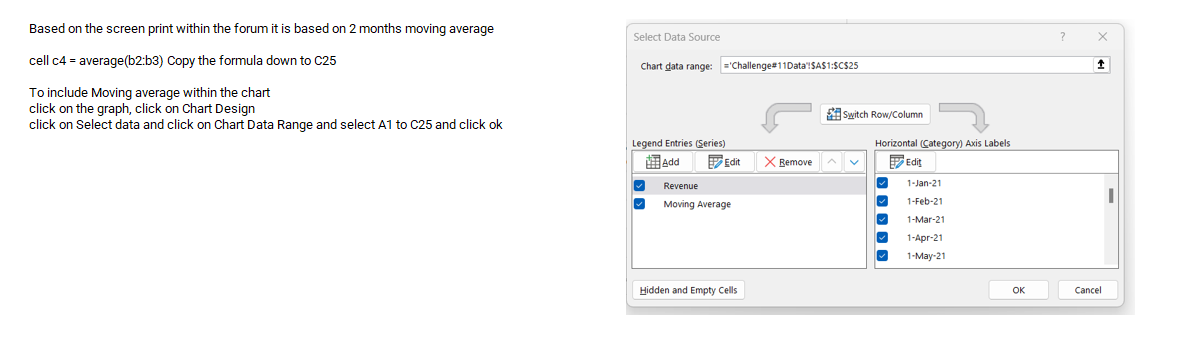
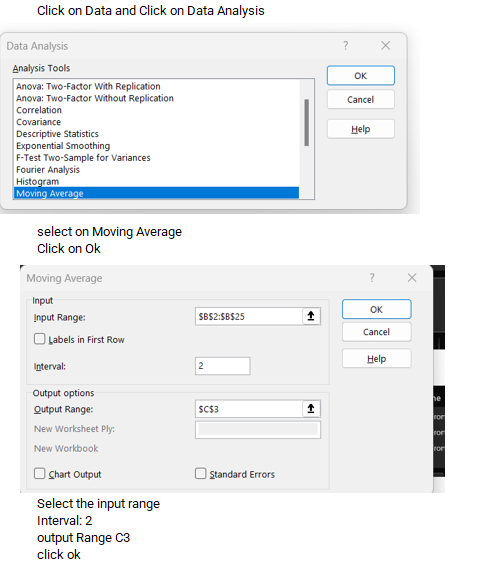
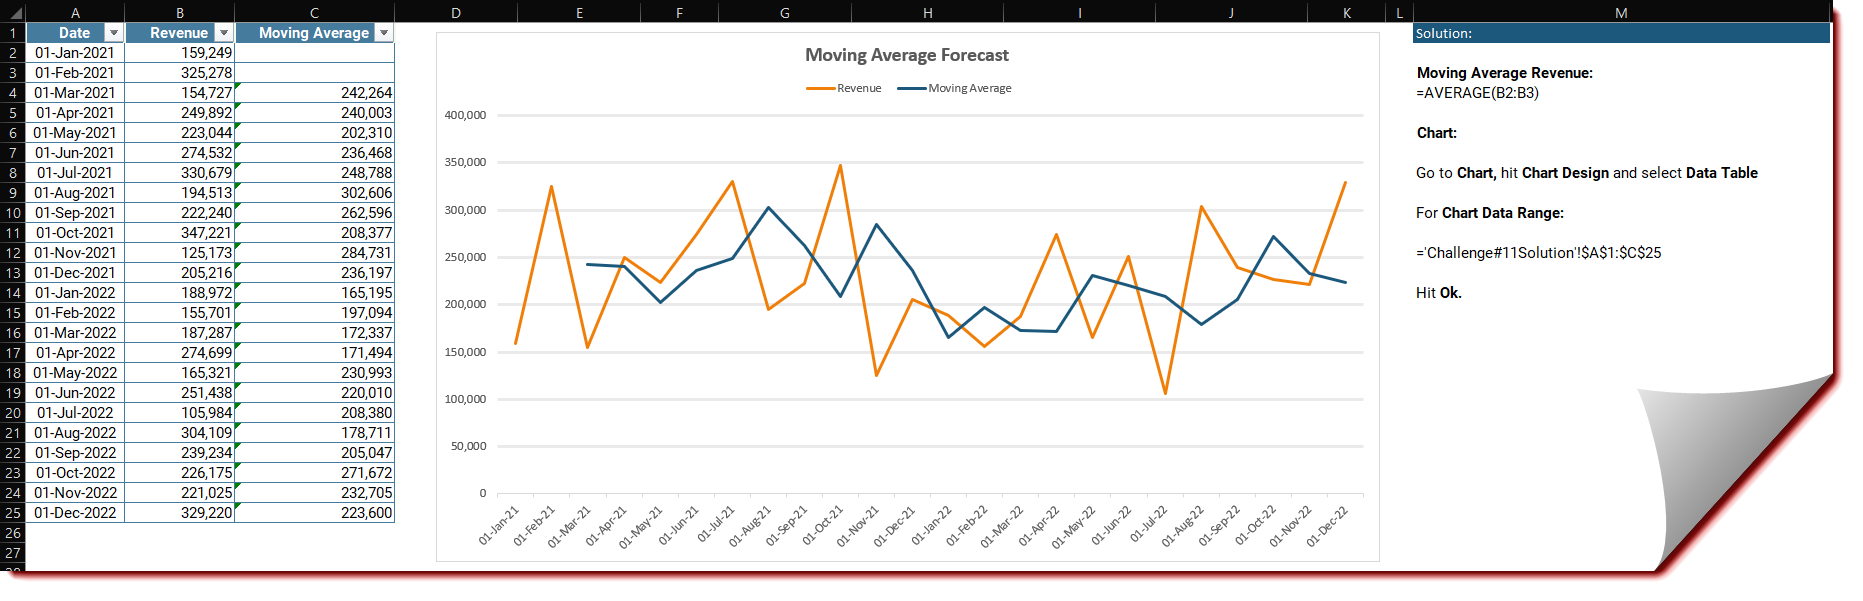
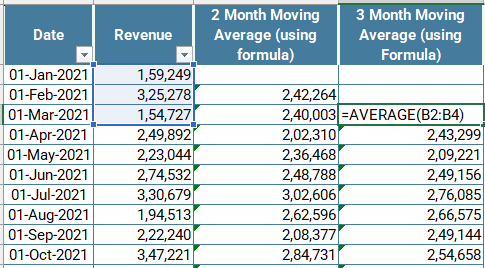
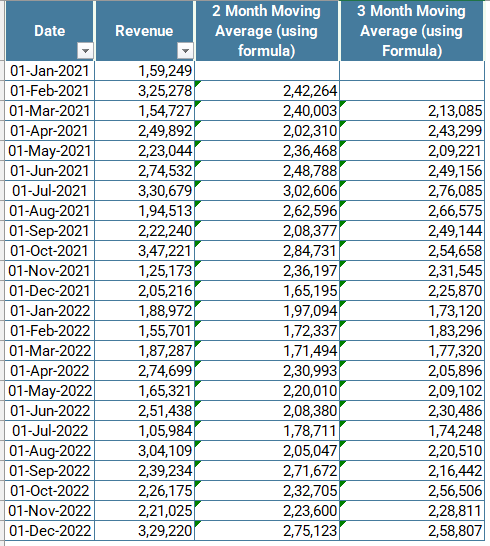
  1. Calculate Revenue Moving Average Forecast
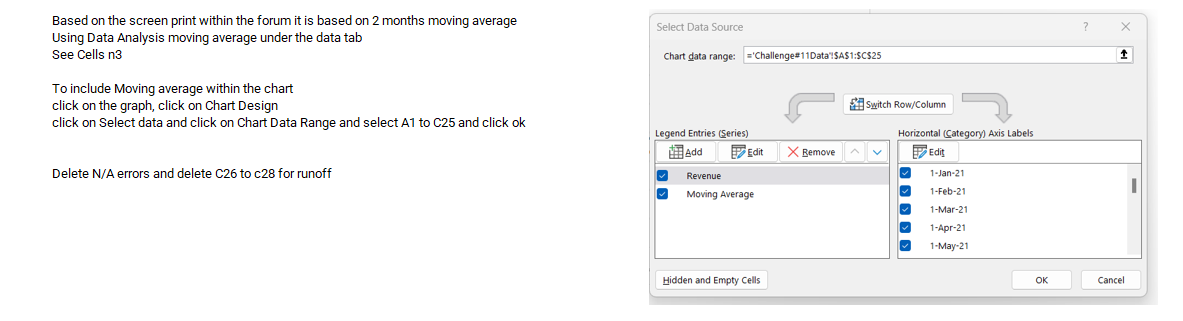
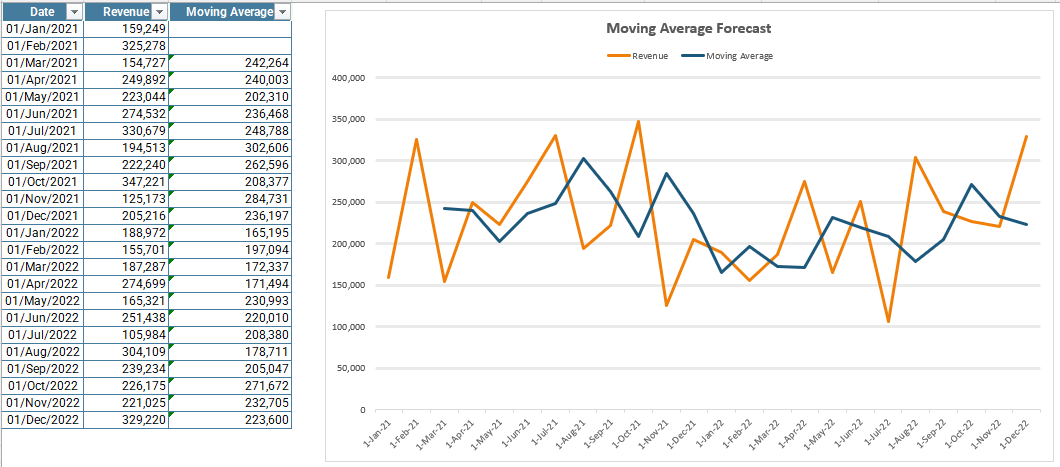
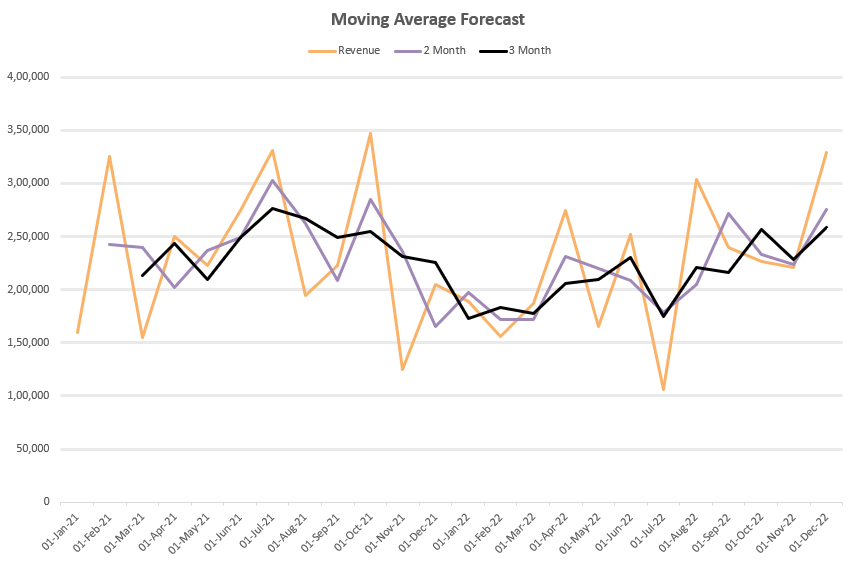
  2. As you can see in the picture, build a line chart that
    reflects both the revenues and the moving average forecasts

Submission
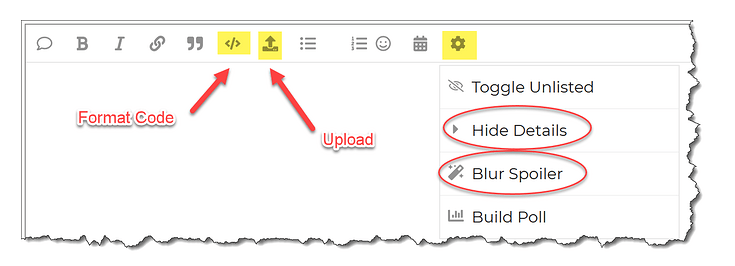
Reply to this post with your formula code and solution file. Please be sure to blur or hide your formula code.

Period
This workout will be released on Monday May 01, 2023 , and the author’s solution will be posted on Sunday May 7, 2023 .

Challenge #11.xlsx (8.3 MB)

Good luck,

Ilgar Zarbaliyev

Hi @IlgarZarbaliyev,

Please see attached file for the Moving Average Forecast.

Its been a while since I used Moving Average. I reviewed youtube videos and the second option was Data Analysis option

From your screen you are calculating a moving average of 2 months of Revenue.

Two way this can be accomplished:

  1. Using the Average Formula
  1. Using Data Analysis - Moving Average

File attached
Excel Workout Challenge #11 Keith Smith.xlsx (8.6 MB)

Thanks
Keith

1 Like

Challenge #11-Quadri.xlsx (8.3 MB)

1 Like

Three ways of doing the challange: with formula, adding a trendline or using the Data Analysis.

Here is my file
Challenge #11.xlsx (1.8 MB)

1 Like

Thank you for participating in the Excel Challenge related to Moving Average Forecast! I hope you found this challenge to be a fun and engaging way to improve your Excel skills and learn more about how to work with Pivot Table in Excel.

Here is my solution to Workout #11:

Challenge #11 with Solution.xlsx (8.4 MB)

Once again, thank you for participating in this Excel Challenge, and I look forward to seeing you in future challenges and learning opportunities!

2-month moving average

=AVERAGE(B2:B3)

Then drag down.

Challenge #11 Tural Mammadov.xlsx (8.3 MB)

1 Like

Formula for 2-Month Moving Average: image

Formula for 3-Month Moving Average: image

Snapshot of the table with calculation:


Snapshot of the chart:


Here’s my workout file: Challenge #11.xlsx (8.3 MB)

1 Like