Data Visualization Workout 004 - Revenues - scenario comparision

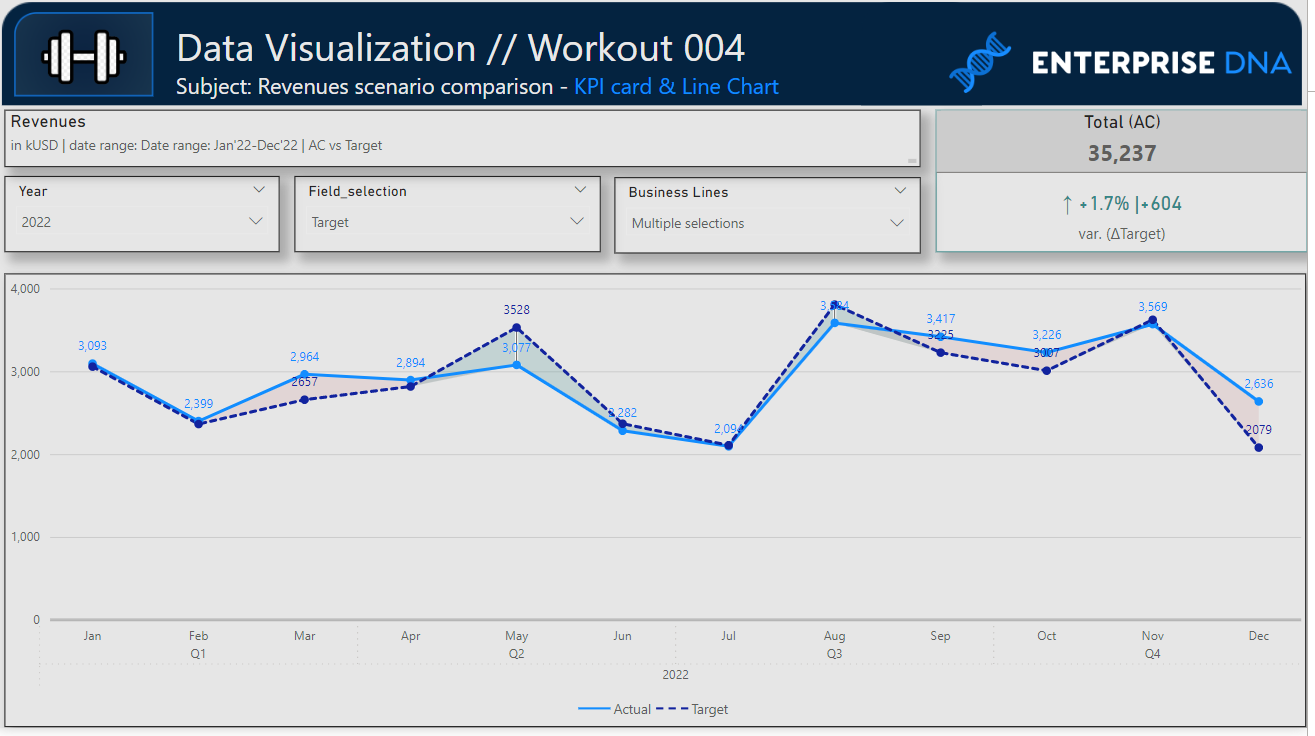
Workout 004 – Revenues: scenario comparision – KPI cards & line chart
Difficulty rating: 3.5 out of 5

Intro note
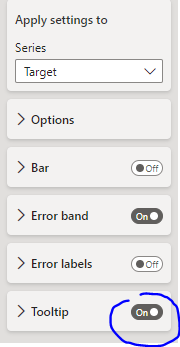
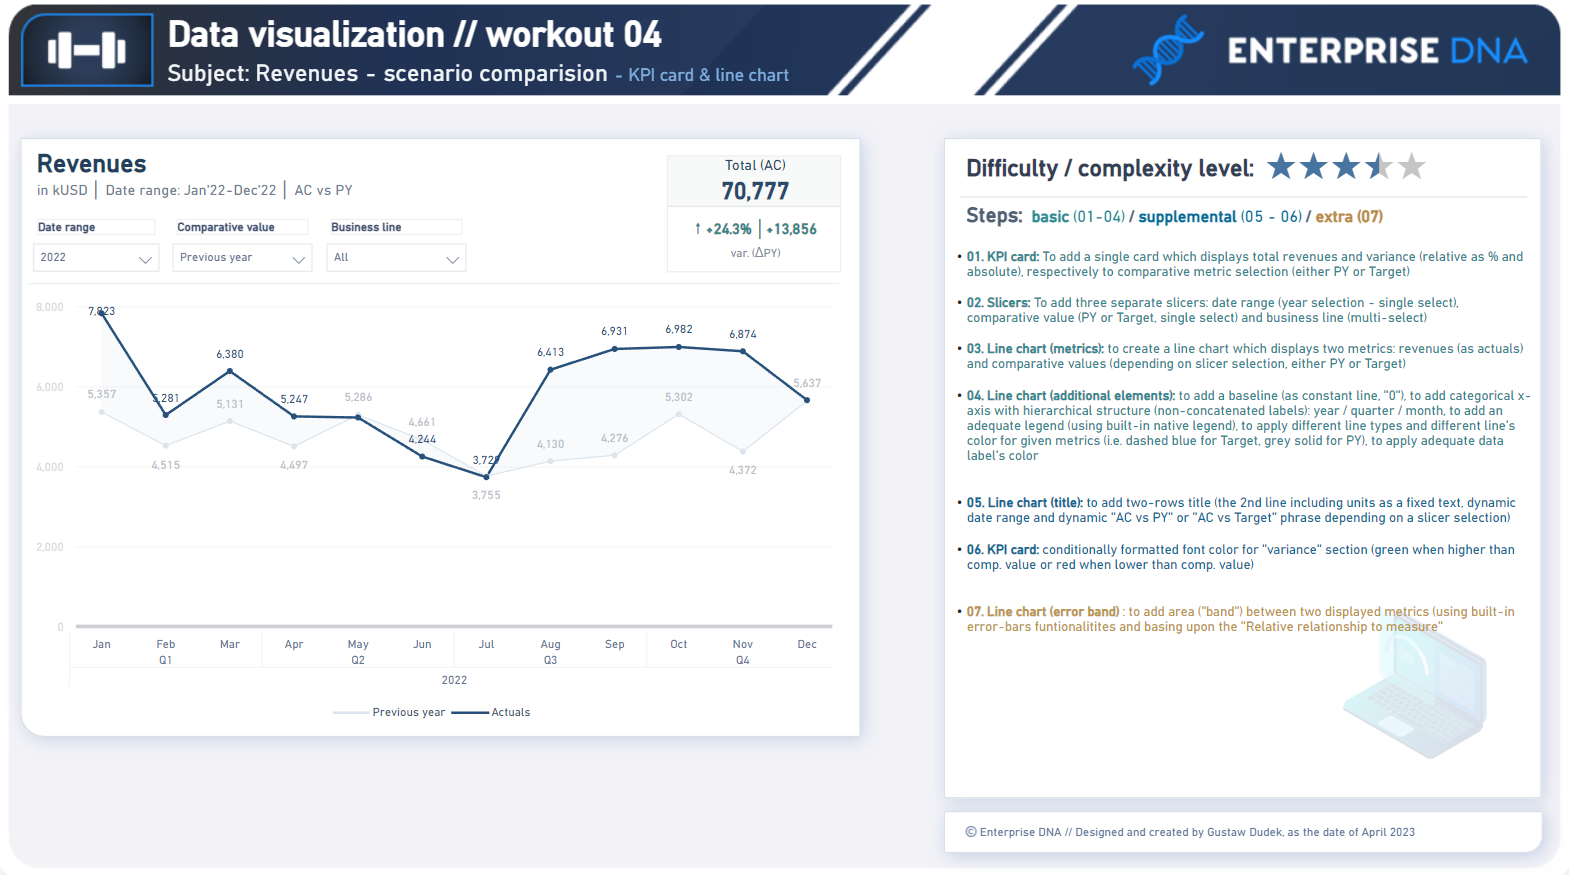
This workout combines various visualization techniques and native functionalities (i.e. field parameters etc). The most important part of the workout is practice - **entries does not have to include every element or functionality to be still considered as great **. Please pay attention to the list of functionalities (provided in the screenshoot and in published-to-web report), which includes ‘basic’ elements (1st-4th point), and supplemental (5th - 6th point) as well as one extra (7th point).

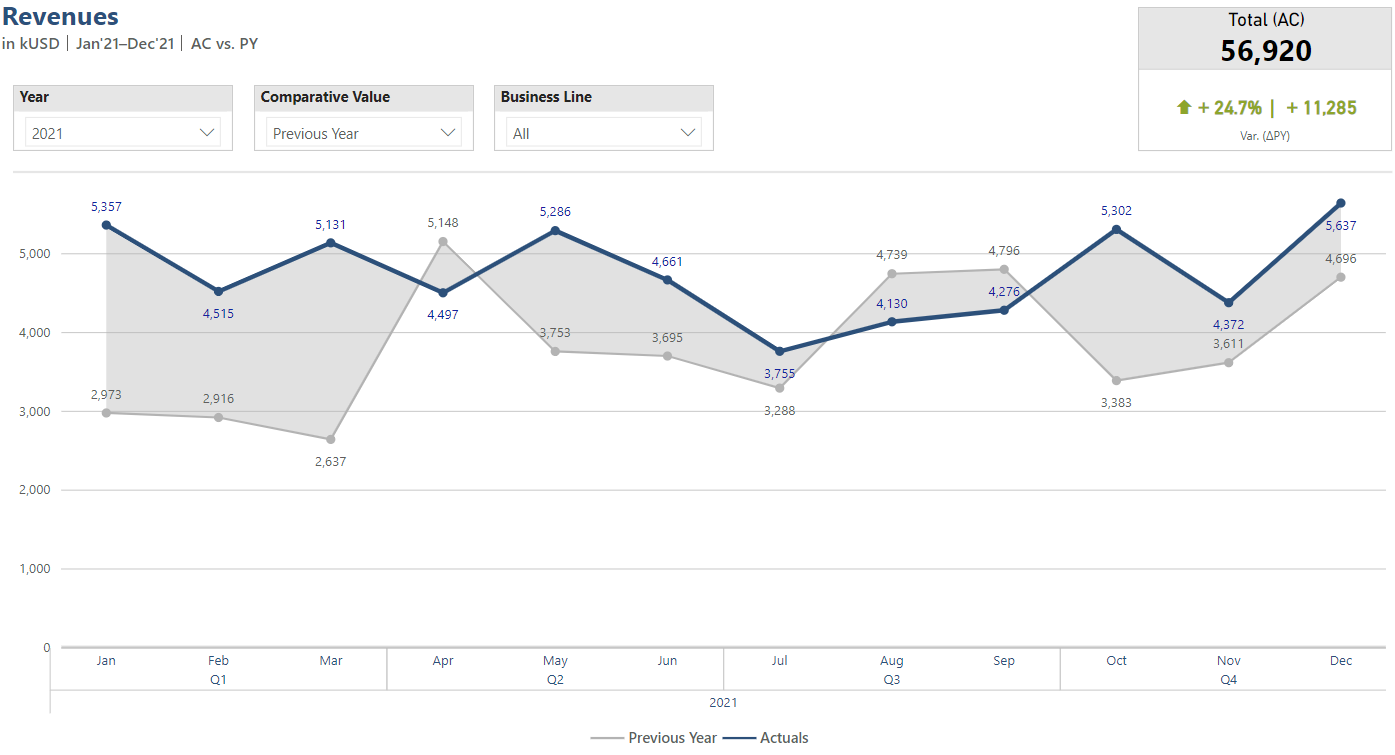
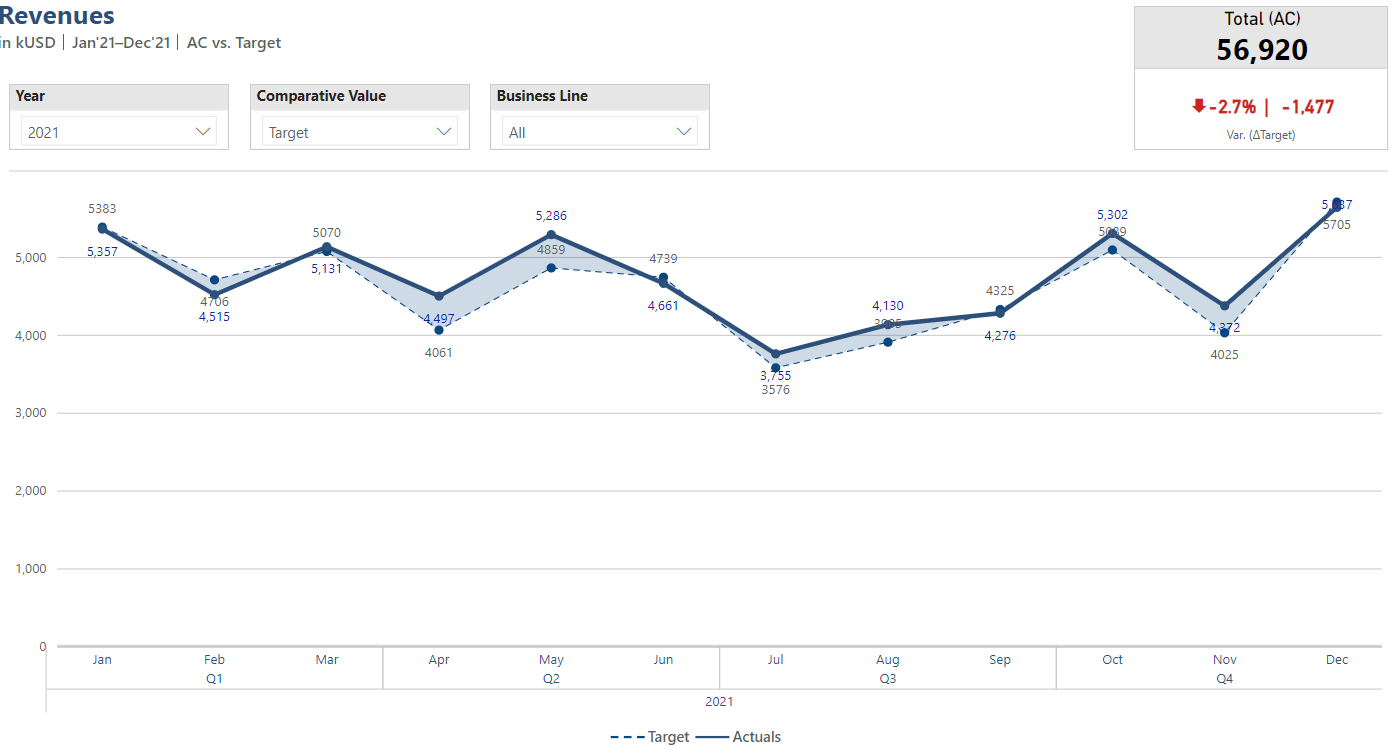
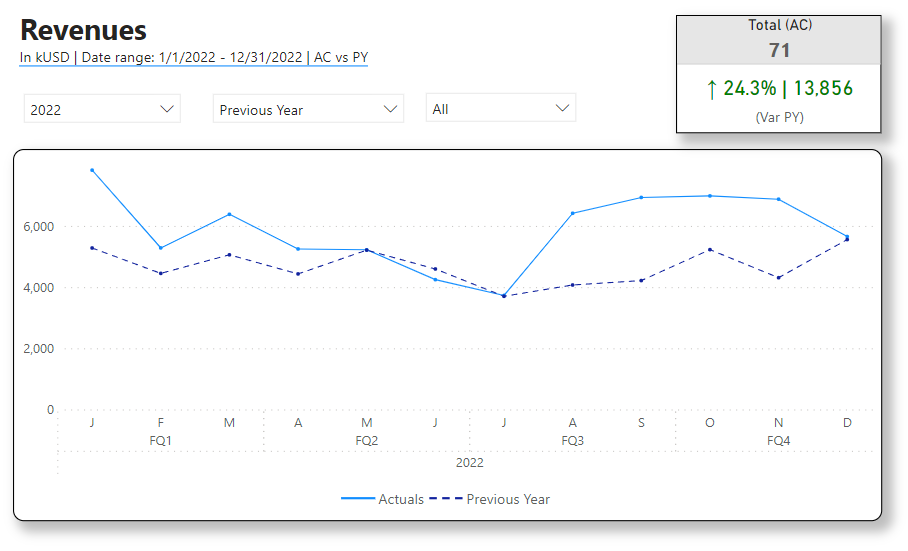
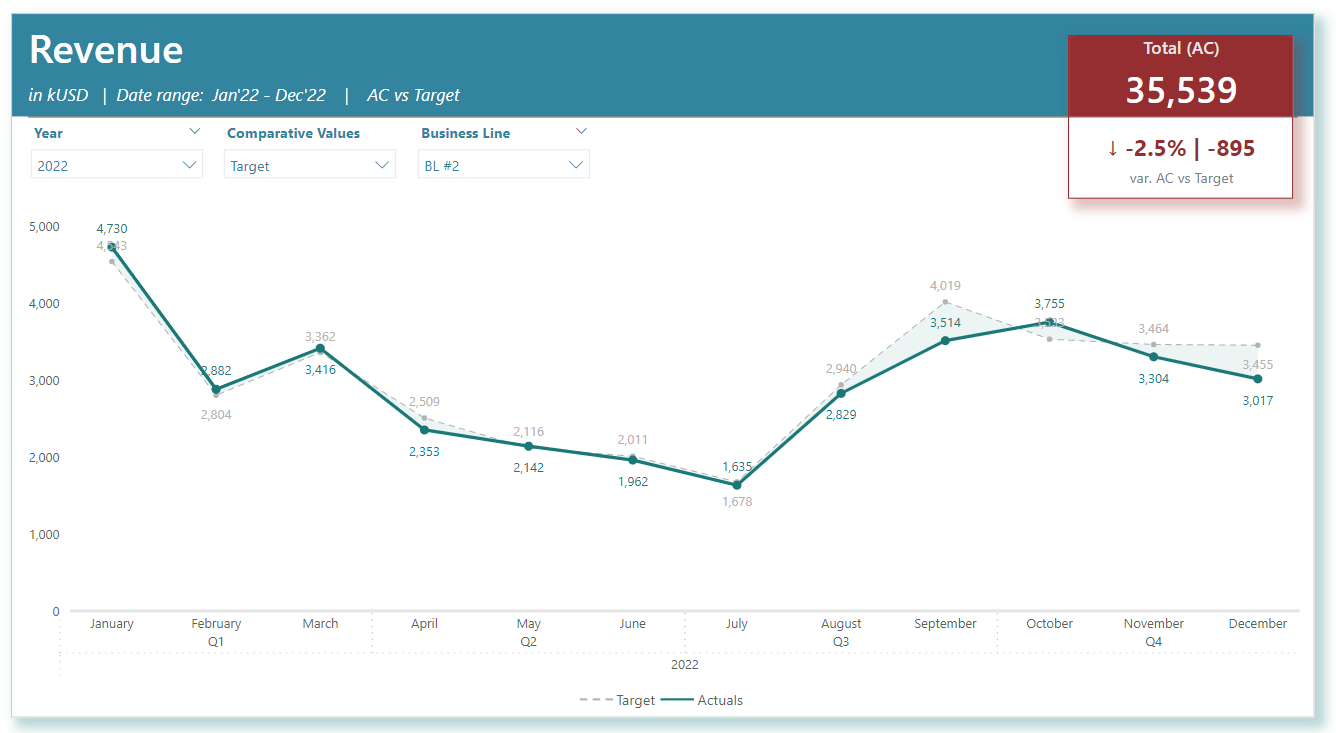
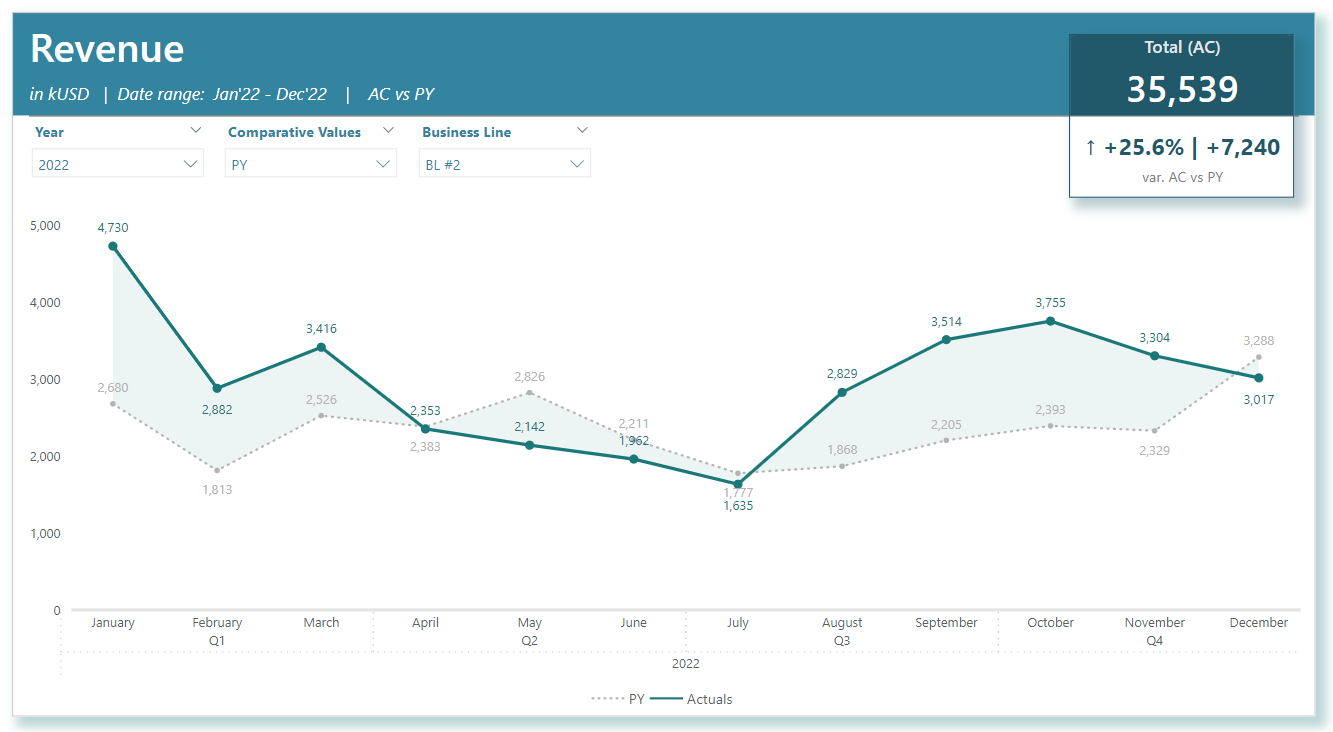
A good starting point is to implement a KPI card and a line chart displaying only revenues and a single comparative value (revenue target). Creating a solution that provides two dynamic comparative metrics / scenarios (which are: Target and PY) will provide additional practice, especially in the context of using field parameters.

Following workout bases on the same data source as provided in workout 003 - if you already participated in the 3rd workout - please feel free to reuse your already transformed datasource / model / measures etc.

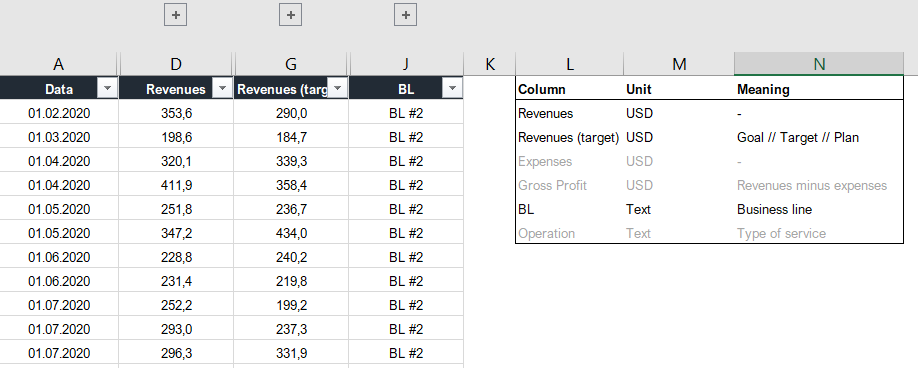
Following workout requires to use only 4 columns from provided dataset** (date, revenues, Revenues [target], BL). There are a few additional columns that are not implemental in the solution. Nevertheless, please feel free to use any columns and any data which is valuable from your perspective. Feel free to use your entries as a part of your project portfolio.

Goals

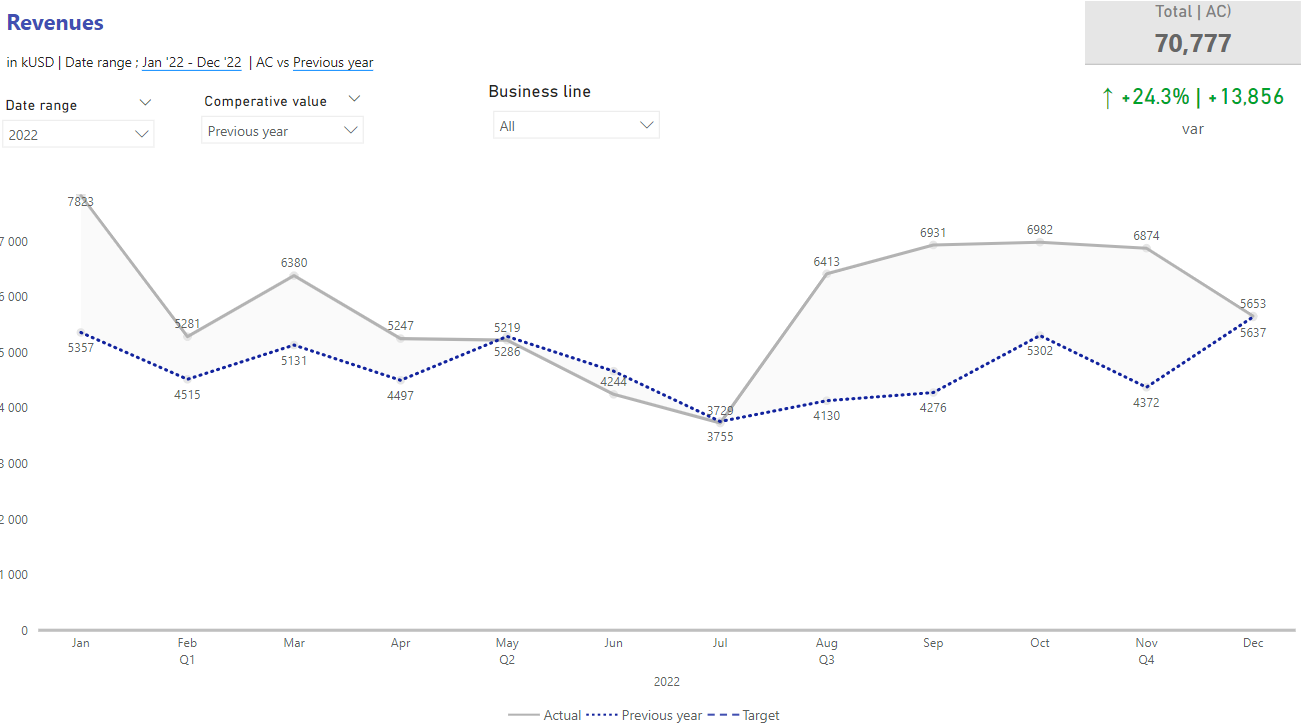
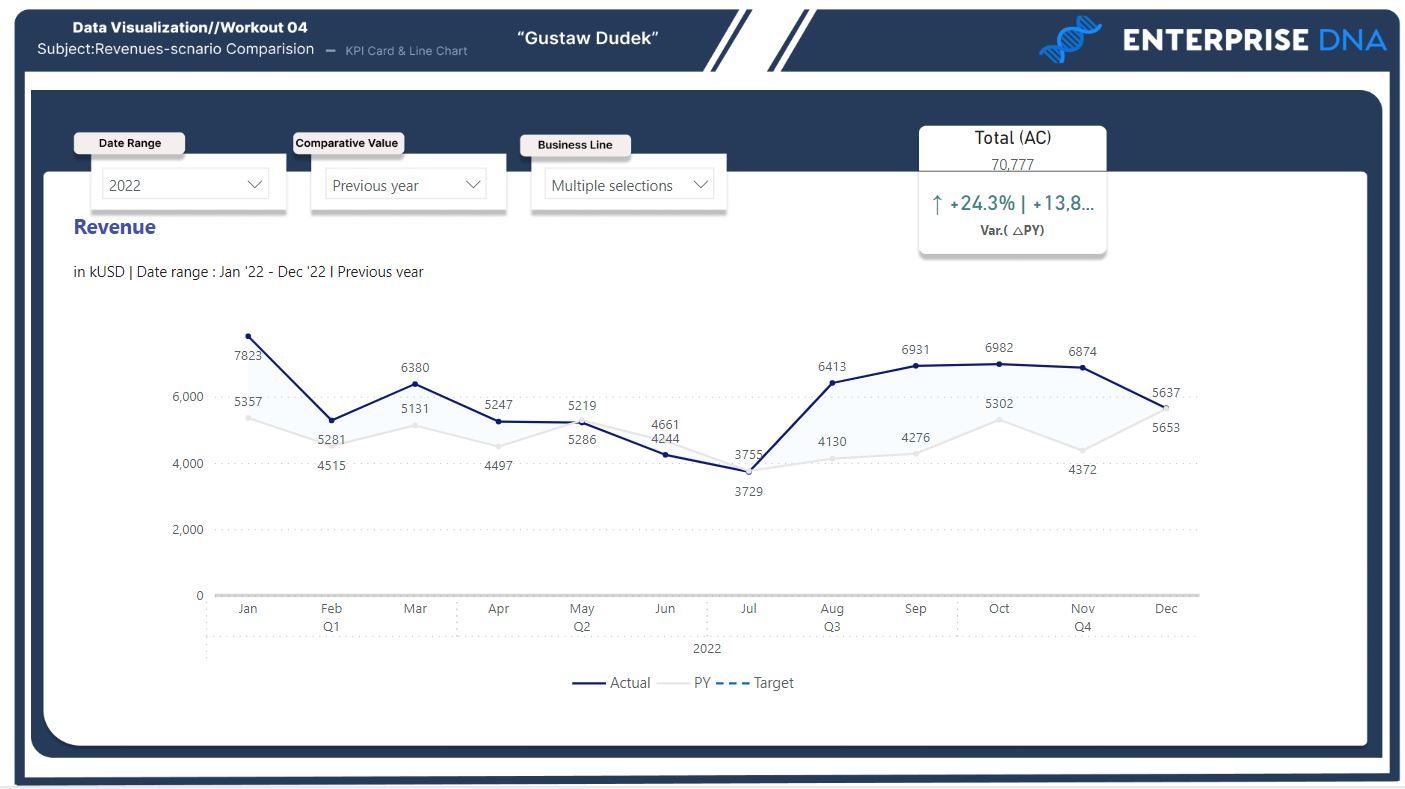
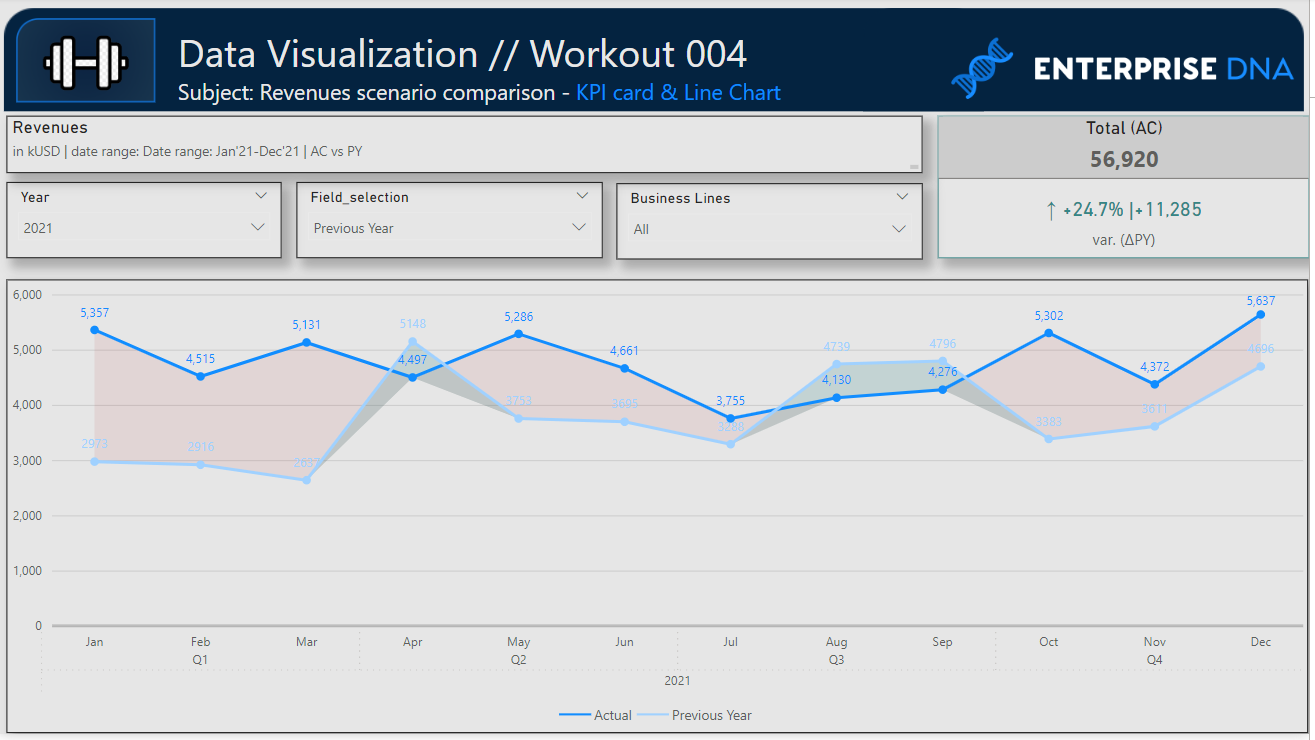
In this workout, using the supplied dataset and reviewing the provided interactive report (link below) we are going to replicate the following set of vizualizations (left section in a report screenshot), including the kpi card, line chart and additional slicers. Also, please feel free to add any extra visual if you would like to (provided that core visualizations are included in the first place).

004 - Workout - Services Profitability.xlsx (924.6 KB)

Core actions (practice) :

    • Making basic calculation (absolute variance and relative variance, PY)
    • Getting familiar with line chart in general (different formatting options, lines, legend etc.)
    • Getting familiar with native cards (customized KPI using title / subtitle / callout value / category label
    • Using field parameters to enhance interactions & dynamic elements
    • Creating informative texts (titles / subtitles)

Submission

Please load the supplied data (xls file) into a Power BI file, replicate visualizations (considerating list of points in the introductory report screenshot and the general design and functionality provided through interactive published-to-web report), and reply to this post including the screenshot (or a gif) of your solution along with the pbix file (please, include name or EDNA forum nick in the pbix name).

Period

This workout is released on Tuesday April 17, 2023, and the author’s solution will be posted on Monday/Tuesday April 24-25, 2023.

Additional materials

Brief introduction to KPI cards using native “cards”:
Cards.pdf (357.0 KB)

Sample presentation of technique that bases on linking two separate field parameters through one supplemental table (might be helpful in achieving effect of dynamic change KPI metric and a line in a line chart at the same time, using a single slicer selection). It refers different report / different measures but the logic is similar:
Field parameters.pdf (678.2 KB)

Link to the interactive dashboard:

Report powered by Power BI

Have a great fun!

Best regards!

9 Likes

Let’s go Sir

3 Likes

Awesome scenario. Nice one Gustaw!

4 Likes

Let’s go Sir More interesting workout

2 Likes

My submition. Not perfect but I’m happy with it anyway :slight_smile:

004 workout.pbix (229.9 KB)

9 Likes

Excellent workout, Gustaw.
Here are my efforts. :slightly_smiling_face:
Workout 004_EDNA_AngelinaMihejenkova

Still have what to improve.
Workout 004_EDNA_AngelinaMihejenkova.pbix (1.1 MB)

5 Likes

@Gustaw, Nice workout! Very well planned.


The first problem I ran into was with the calculation for Var. (ΔTarget). I spent a long time puzzling over why my values differed from yours in the linked report. I finally gave up with the hope that somehow the target values in the sample data differed from those in your report.

Because I was unable to generate a dynamic label for the card callout value, I cheated and overlayed a button showing either “Var. (ΔTarget)” or "“Var. (ΔPY)” depending on the selected value of Comparative Value (which is a little tricky because it’s part of multi-part key.

Also, the tooltip on the line chart shows the error bar symbol. I wasn’t able to remove that.

dataviz004.pbix (160.6 KB)

6 Likes

@HufferD

Well done! Incredible remake!

A brief feedback on some of your points:

  1. Differences in target values - thank you for this catch. It’s exactly as you assumed - it was due to differences in the provided dataset vs what is shown in the attached screen and in interactive report. I just unified this datasource versions (numbers). Really sorry that you spent some time on searching for a reason.

  2. Nice workaround. You are able to achieve dynamic dynamic label using field parameter as callout value, similarly as you did with your line chart.

  3. You are able to hide this labels by turning off the following option in error-bar section:
    image

Amazing work! Thank you for participation!

3 Likes

@Gustaw - another great workout. Here is mine. I was able to hit all of the items with the exception of the last one. And I didn’t hit the formatting exactly mainly due to limited time (was getting late in the evening). But I definitely enjoyed seeing the various tricks to create the dynamic KPI card (and the dynamic title, etc.).

Thanks for putting this one together. Looking forward to next weeks!

4 Likes

Thanx for the solution to hiding the error bar labels. I didn’t realize I could do it within the error bar section. Thank you for the weekly challenge!"

4 Likes

Here is my input for this workout, I had a lot of fun. :grinning:

A big thank you to @AngelinaMihejenkova for the KPI color formula that inspired me .

Looking forward to next weeks.
004RMA
004 Workout - Remi Martinato.pbix (579.4 KB)

3 Likes

Hi
Thanks for the nice words. Glad to be helpful. :+1:

3 Likes

@Gustaw Thanks for another Data Visualization workout. It’s a great opportunity to sharpen our skills and get valuable feedback.

Here’s my submission.
Workout04 - Rhix

5 Likes

Thanks Gustaw, I have seen these workouts on LInkedIn, and the content looks fantastic, and something we can actually use in a more professional setting.

I think I followed all the requirements, had a little bit of trouble finally setting the colour formats in the card chart, but got there in the end.

I applied a little of my own styling and colour theme.


One item that stumped me a little, was getting a gap between the subtitle and the chart to allow to squeeze in the slicers. I used a MAXX formula to extend the y axis and then covered it with the slicers. Not sure if that is what others did or there is a way to increase the gap (empty characters?)

Thanks again

7 Likes

Looks great @GerardDuggan

1 Like

hi !
I really enjoyed this workout !
please find my solution.
Gustaw, I saw your report uses very cool tooltips. Where and how can those be setup ??? I cannot find it.
Another question: on point 7 you asked to use Relative relationship to measure. Does this have particular advantages ? I used Absolute relationship and find an easy (in my opinion) way to use different color in case of Actual is higher or lower than the selected comparison measure (PY or Target).
thanks and ciao !


Roberto Ravani - workout 004 - Service s Profit Analysis OK 1.pbix (456.7 KB)

4 Likes

Thanks Gustaw for another awesome workout. Here is my solution:


Workout Ch4 KIP Card Line Chart v1 Kim Cook.pbix (586.3 KB)

2 Likes

Thanks @Gustaw for the great workout. Love the KPI card


EDNA Visuals 004.pbix (522.8 KB)

Report link

4 Likes

Another great workout! I have to admit, it took me some time to get the formatting right!

Workout4

004 Workout - Jakub Sokol.pbix (506.7 KB)

2 Likes

@Gustaw, do you have any tips on how to prevent data labels from overlapping? In some cases, when values are similar, the labels tend to overlap. Simply positioning the labels ‘above’ or ‘below’ the line may not be a practical solution since the lines are dynamic.

1 Like