Hello everyone,
I’ve been struggling the past few days with DAX-formulas to compare several years.
On the internet there are several formulas but none of them gives me the result I want.
What’s the problem/challenge?
I’ve got 2 tables:
- Calendar;
- Model Fct_InvoiceLine, a fact-table with invoicelines from 2014-2018
I want to compare the number of customers and the amount of Sales during the years 2014-2018.
The result in the end:
- New customers: Number of customers and amount of Sales for each year
- Steady customers:
- Won revenue: number of customers and amount Sales for each year
- Steady: number of customers and amount Sales for each year
- Lost revenue: number of customers and amount Sales for each year
A steady customer is a customer with Sales in each year but the new Sales is more, less or the same as the previous year.
- Lost customers: Number of customers and amount of Sales for each year
My measures:
Total Turnover = SUM (‘Model Fct_InvoiceLine’[InvoiceLineTotalAmountExclVAT]
Number of Customers =
CALCULATE (
DISTINCTCOUNT ( ‘Model Fct_InvoiceLine’[Customernumber] );
FILTER ( ALL ( ‘Model Fct_InvoiceLine’[Customernumber] ); [Total Turnover] <> 0 )
)
The numbers from the measures mentioned above seems to be right.
At this point I need to go further but I’m lost.
I think that I have to make a virtual table with customernumber and sales for each year and after that I want to compare those tables with each other. I thought to use EXCEPT and SELECTEDCOLUMNS but I don’t know exactly how to use them.
Can you help me?
Thanks in advance,
Cor
1 Like
Hi Cor,
Just before start on this.
Can we review this please.
https://forum.enterprisedna.co/t/how-to-ask-support-questions-on-the-forum/30
There are multiple questions in the one post and these need to be broken up into separate posts with the correct titles etc.
Then can work through one by one.
Happy to assist with this but there’s a lot of work and investigation required on these, because some of them are complex and depend on a number of things, like how you want to showcase the insight etc.
Chrs
Ok let’s go over the logic here exactly because I don’t quite understand it right now.
Can you describe the logic behind these in more detail. How do you differentiate between these?
Steady (please exact figures)
New
Lost
Thanks
Sam
Hi Sam,
I’m sorry, I understand that I should have broken up my questions in separate posts.
As attachments you will hopefully find a better explanation of my challenge.
So, here is the logic:
A new customer is a customer with sales in the current year and no sales in the previous year.
A steady customer is a customer with Sales in the current and in the previous year.
A lost customer is a customer with no Sales in de current year and Sales in the previous year.
In the first attachment you will find a statement with the (dummy) calculations for the years 2015-2016.
In the second attachment you will find a statement with customers with Sales (Dutch: Omzet) for the years 2014-2018 and the differences (Dutch: verschil) between the figures for the years 2014-2018.
The result in the end should be to have a report like attachment jpg 1 but dynamic. The end user should have the possibility to choose a selected period.
With kind regards,
Cor
Ok thanks for these.
First up this is very complex. You’re really jumping in the deep end here. But a nice challenge.
Let’s start with one and attempt to get the right answer there first (I might break these out into different posts, as they all will have quite different and interesting logic to work through)
New Customers = a customer with a sales in the current year and no sales in the previous year.
I believe this will get you what you need for this
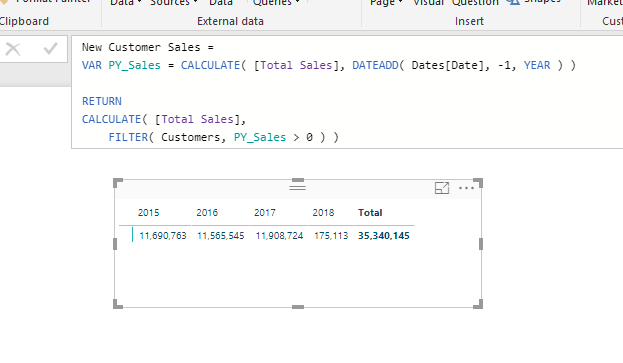
New Customer Sales =
VAR PY_Sales = CALCULATE( [Total Sales], DATEADD( Dates[Date], -1, YEAR ) )

RETURN
CALCULATE( [Total Sales],
    FILTER( Customers, PY_Sales > 0 ) )
See image
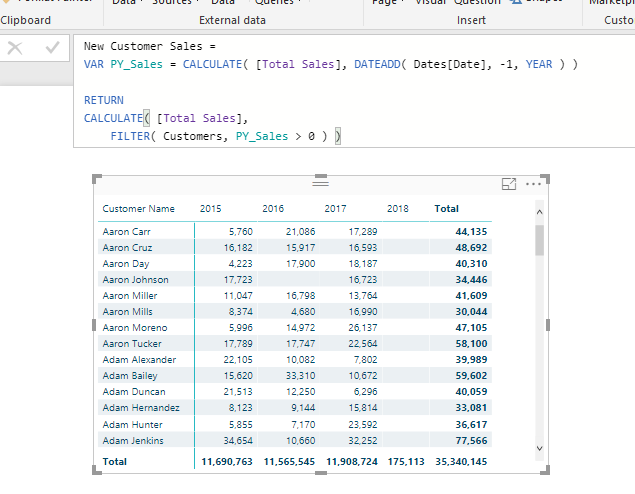
This formula should also work in this context
You’re going to find it difficult to get the same format you have in the excel example you show.
I think you’ll want to investigate a more appropriate Power BI like visualization technique once all the logic is sorted.
Hi Sam,
Thanks for your reply. I know this is very complex, the last week I’ve been struggling with this challenge.
I’ve made a dummy model with a few invoices, maybe we can use this model to count the customers and the amount of Sales:
Further I’ve made an example of a report. The numbers is what count, not the format 
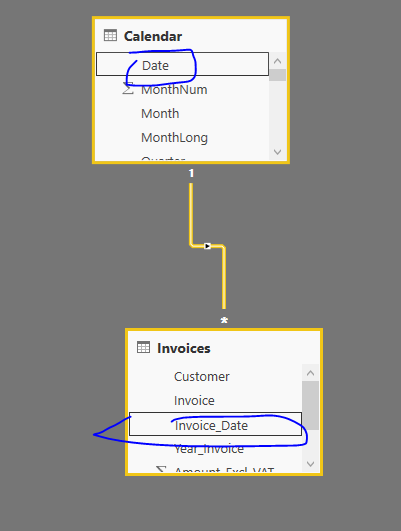
The relationship between the 2 tables:
Can you help me with the DAX-formula to count the number of customers for each year?
Thanks in advance,
Greetings from a rainy Holland,
Cor
Hi Sam,
I’ve made a mistake in the report: the lost revenues % # Customers was wrong. The correct report should be:
Chrs,
Cor
First that relationship isn’t right. It should be a one to many (*)…no multi directional
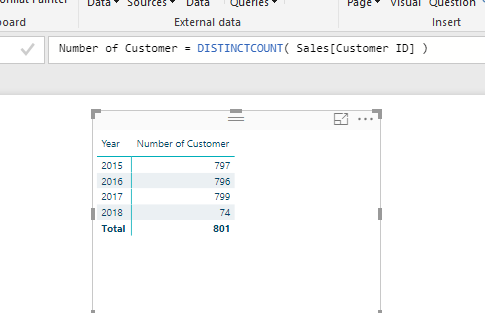
So just to count the amount of unique customers would be as easy as the technique I use below
Is this what you initially need?
Number of Customers = DISTINCTCOUNT( Sales[Customer ID] )
Hi Sam,
Thanks for your reply. In the meantime I’ve made the DAX-formulas for New and Steady customers:
Can you help me with the formula for Lost customers? Now I have the numbers for New and Steady customers, how can I connect these numbers with the amount of Sales?
Thanks in advance,
Cor
Ok I’ll break this up because there is a lot to it.
First calculate this
Customers with Sales before today =
VAR EarliestDate = CALCULATE( MIN( Dates[Date] ), ALL( Dates ) )

RETURN
CALCULATE(
    COUNTROWS( SUMMARIZE( Sales, Customers[Customer Name] ) ),
        DATESBETWEEN( Dates[Date], EarliestDate, MAX( Dates[Date] ) ) )
Then this
Customers w/Sales Last 90 Days =
CALCULATE(
    COUNTROWS( SUMMARIZE( Sales, Customers[Customer Name] ) ),
        DATESBETWEEN( Dates[Date], MAX( Dates[Date] ) - 90, MAX( Dates[Date] ) ) )
Then subtract one from the other
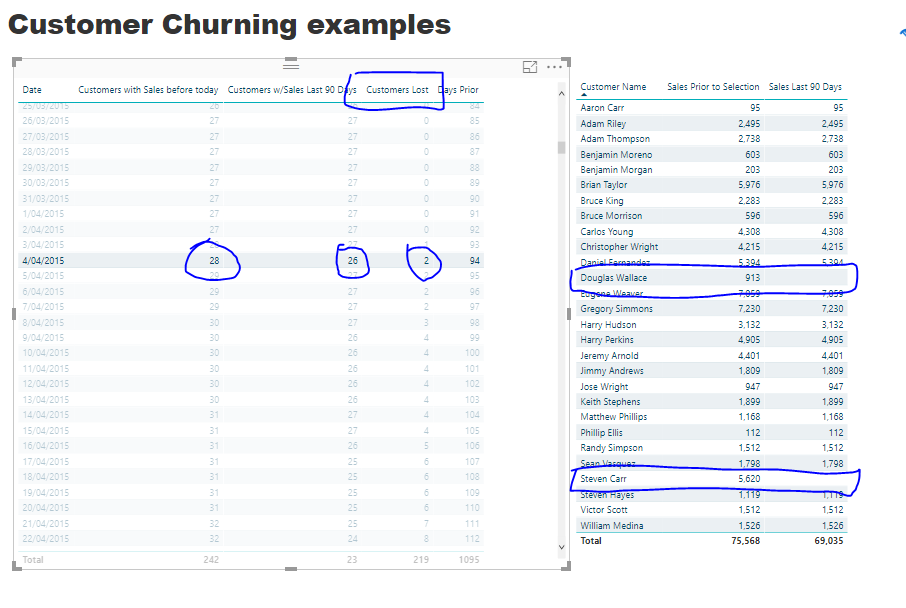
Customers Lost = [Customers with Sales before today] - [Customers w/Sales Last 90 Days]
I’ve been testing this and been getting the results based on my model, but calculations are intensive so it take some time to update
1 Like
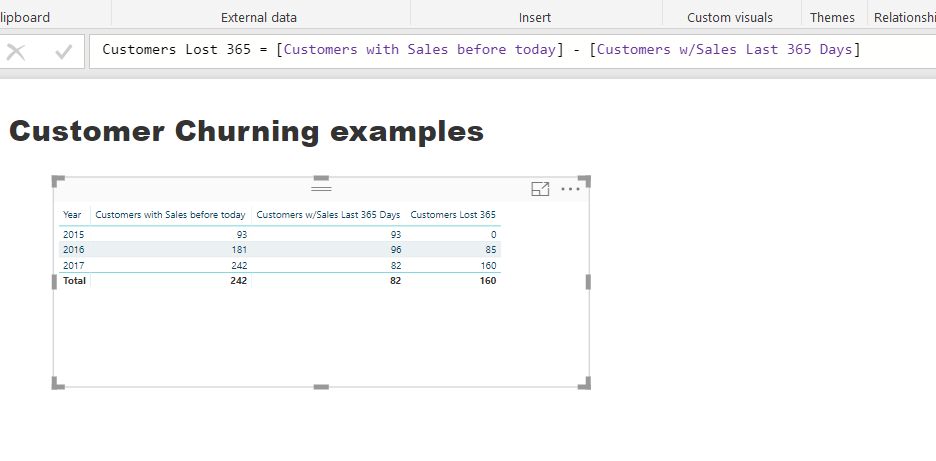
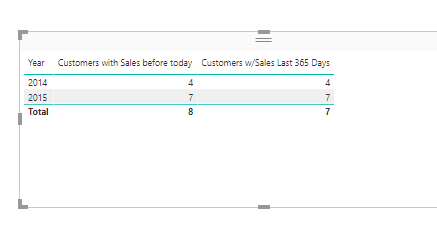
Thanks Sam, it’s working, see photo. At our office we are working with customers with a annual subscription so I changed the formula to “Customers w/Sales Last 365 days”.
As you can see it is working on a daily basis, when I change the initial filter to years only the Total is correct. I know that years and days are a different granularity. How can I change that table so it will display the years and the lost customers? (2015: 1 ; 2016: 2 ; 2017:2 makes Total 5)?
With kind regards,
Cor
I’m wondering why exactly the same logic doesn’t work.
It seems to work when I change the context to year instead of the date
I’ve reviewed the example you have sent me.
The reason I see that you are receiving zeros is because the answer is zero.
It’s really as simple as that.
Maybe you’ve sent me a file without all the data.
But when I break out the results this is what I get and why it returns zeros for lost customers
I don’t understand Sam. Why is the answer zero?
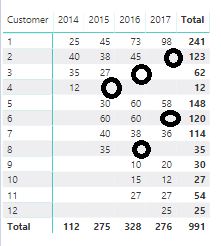
For 2015 it should be 1, for 2016 the answer should be 2 and for 2017 it should also be 2.
In the following visual the total is 5, but the figures for each year are zero. Why is that?

The file I’ve sent you has a datatable called “Invoices”, that is the only fact-table.
This is why this is complex.
The totals are relatively meaningless in this case.
It seems that as some customer are lost new ones come in so it’s look like the formula will need to be adjusted.
I will have to review.
After spending a crazy amount of time trying to understand why this wasn’t working it all was because of the relationship!
Because the relationship was based on the keys not the dates, for some reason (can’t tell exactly right now) it wasn’t able to calculate it.
Once I changed this everything worked properly

That’s all you have to do in your model
I didn’t think about that Sam, I thought the relationship with the key was correct but I’m glad you’ve found the solution. Thanks for it!
I saw that the number of Customers Lost is a cumulative one, is it possible to get, for example, year 2015: 1, year 2016: 2 and year 2017: 2?
For the amounts I’ve made the following measures:
I’ve made a couple of new measures:
Sales Customers with Sales before today =
VAR EarliestDate = CALCULATE( MIN( ‘Calendar’[Date] ); ALL(‘Calendar’ ) )
RETURN
CALCULATE(
    [Total Sales];
    ( SUMMARIZE( Invoices; Invoices[Customer] ) );
        DATESBETWEEN( 'Calendar'[Date]; EarliestDate; MAX( 'Calendar'[Date] ) ) )


Sales Customers w/Sales Last 365 Days =
CALCULATE(
    [Total Sales];
    ( SUMMARIZE( Invoices; Invoices[Customer] ) );
        DATESBETWEEN( 'Calendar'[Date]; MAX( 'Calendar'[Date] ) - 365; MAX( 'Calendar'[Date] ) ) )
Sales Customers Lost = [Sales Customers with Sales before today] - [Sales Customers w/Sales Last 365 Days]
Result:
Sales Customers with Sales before today: a cumulative one;
Sales Customers w/Sales Last 365 days: seems right, every year has a SUM of the Sales of that year;
Sales Customers Lost: the numbers are not right.
What do I have to do to improve my measures?
Sam, I’ve read the books from Russo/Ferrari, Rob Collie, Avi Singh and Matt Allington but I’ve learned the most from you, many thanks!!!
Regards,
Cor
1 Like
Hi Sam,
In the meantime I’ve made new measures:
Diff. Sales TY vs LY = [Total Sales] - [Total Sales LY]
Sales New Customers =
VAR
    Customerlist = VALUES(Invoices[Customer])
RETURN
CALCULATE([Total Sales];
    (VALUES('Invoices'[Customer] ) );
    FILTER(
        Customerlist;
        CALCULATE(COUNTROWS(Invoices);
            FILTER(ALLSELECTED('Calendar');'Calendar'[Date] < MIN('Calendar'[Date] ) ) ) = 0) )

Sales Steady Customers =
[Total Sales] (
    CALCULATETABLE (
        VALUES ( Invoices[Customer] );
        VALUES ( Invoices[Customer] );
        FILTER (
            ALL ( 'Calendar' );
            'Calendar'[Date] < MIN ( 'Calendar'[Date] )
        )
    )
)
The result:
Questions:
- The previous report for Customers Lost was a cumulative one, is it possible to have the numbers for each year?
- For the steady customers I want to calculate the amount of Lost Revenue - Steady Revenue and Won Revenue. Can you help me with that formula?
Thanks in advance, Sam!
Regards,
Cor
Looking into this now. Just as a side note. Check out this video I made about placing formulas into posts
https://forum.enterprisedna.co/t/how-place-dax-formula-into-forum-topics-posts/156


