Tall Narrow Data vs Wide Short Data (Preprocessed)

My Data table is preprocessed and has 1 dimension “Market Segment” and 12 measures. It is formatted Wide and Short. I have unpivoted measure and made it narrow and long. Either way I can get the exact same result when using the matrix.
Question:
If I use the narrow/long format, is it best practice to CREATE A MEASURE for each existing measure in my original table?

Tall and Narrow vs Wide and Short|690x361

@DMercier,

VERY generally speaking, fact tables should be thin and long, dimension tables short and wide. But rather than following general rules, my approach before I start data modeling is to develop an analysis plan, laying out the questions I want to answer and the general analyses I will do to answer those questions.

At that point, data modeling becomes a much more specific exercise – how do I set up my data to best answer those particular questions and secondarily, how can I best build in flexibility to address likely future questions?

In some cases, I actually create a second version of my fact table referenced off the first one, with the second one taking a different shape (e.g. pivoted or unpivoted) and only used for very specific analyses or visuals. (If you want to see examples of this, my data challenge write ups for Data Challenge #7 and #11 both discuss this technique).

In terms of re-creating measures, I would say only re-create those you need – often times reshaping your tables will result in far fewer measures needed.

One thing definitely not to do – do not name a physical column “measure” as you’ve done here. That becomes incredibly confusing – call it “metric” or “measurement” or “objective”, anything but measure.

Probably not the definitive answer you were hoping for, but hopefully that’s still somewhat helpful.

– Brian

3 Likes

@BrianJ,

Thank you for taking the time to respond. I appreciate the complexity of the response. I am creating a visual now and using both data tables to see the impact to level of effort given the filtering dynamics I am planning. Also, I appreciate the wisdom of not naming the physical column “measure”. I am headed now to review the data challenges you referenced.

@BrianJ

A follow on question:
I am creating a card for TOTAL REVENUE:
I did it 3 ways and all give the same answer.
My question is, which would you use assuming it’s a basic set of visuals:
YTD vs Goal
By Market Sector
By Office
By Project Manager

I have attached the 3 scenarios


Power BI uses columnar database for store data. Therefore if the table thin and long , it can easily store the data and have quick data retrieval.

@akila789

Thank you for the quick response.
I take it that the benefits of speed as things get complex is the key driver in the decision.

@DMercier,

@akila789’s point about speed is a good one, but unless your dataset is quite large probably not the overriding reason why long and thin for fact table works best. The columnar aspect is the key. Think about most DAX measures, which follow a pattern similar to this:

Sales Not Red =
CALCULATE(
	SUM( Sales[Amount] ),
	Product[Category] <> "Furniture"
)

The measure totals down the Amount column in the fact table, filtered by an adjacent column linked via relationship to the Products dimension table. This is inherently a long and thin structure. You can add a million more rows to the data and measure doesn’t change, even if those rows include a bunch of new categories.

But imagine if the data instead were structured with separate columns for each product category’s sales. Now your measure has to explicitly sum each column that isn’t red, and the measure breaks if you add additional data with new categories.

Here’s a thread that has a real-world example of how much easier the DAX becomes when dealing with a long and thin structure, and embedded in that post is a second example of a different scenario showing the same result.

In terms of your particular structure, I can’t tell enough just from looking at the screenshots you provided – I really need to look at the data, the data model and the measures together. Thus, if you can please send aa PBIX file, I will be able to provide more specific guidance. If your data includes any sensitive information, here’s a video on simple techniques for masking confidential data to allow posting in the forum.

I hope this is helpful

  • Brian
2 Likes

@DMercier,

Okay, you are on a very good track here – I have built some very powerful financial reporting applications using a master transaction table very similar in structure to the fact table you are using here, so solid foundation to start with. With regard to your question about the three methods, you can definitely discard method #1, which fails to take advantage of the powerful data model you are building. However, methods #2 and #3 are not incompatible, and in fact I would look at these as two sides of the same coin. In some situations you’ll want to use a slicer and take advantage of the dynamic visualization aspects that you’ve noted. In other situations, you are not going to want to have to rely on a slicer, and will set the filter conditions in the measure the way you’ve done in method #2.

However, there are still two big issues to resolve here:

  1. the easy one is that you want to steer completely clear of using implicit measures like this one that you use for method #3

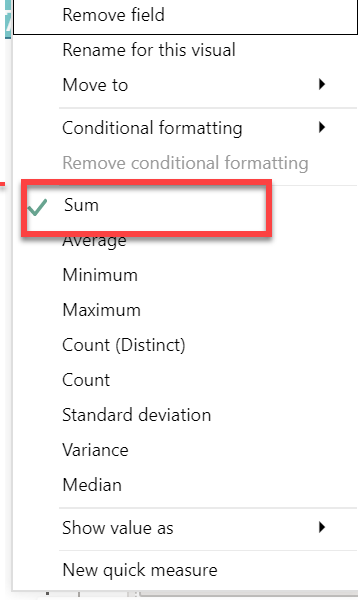
There are a number of features in Power BI that Microsoft has included ostensibly to make the program easier for beginners but that lead to bad practices. This is one of those cases. Instead of using the sum function in the visual, create an explicit measure – Total Value = SUM(P7RevPerMkt[Value] ). If you want to read about why explicit measure should be preferred over implicit measures, I would refer you to the thread below which references an excellent video by @sam.mckay on this topic.

Also note “Value” is not a great name to use for a column, since some advanced DAX functions return that as a column name default. Instead use something like “Amount”.

  1. the much bigger issue here is that you have a granularity mismatch between your calendar table and your fact table. The former is daily granularity, whereas the latter is weekly. You can connect the two tables with those date fields and it won’t return an error, but if you perform certain time intelligence functions you will get incorrect results. There are two primary ways to fix this – the first is to delete the physical relationship between the date table in the fact table and create a virtual relationship via TREATAS while allocating your fact table amounts down to a daily granularity level using DAX. Sam has many videos on this topic, since it is a very common problem in budgeting. Here’s an excellent one that walks through the allocation method to fix the granularity mismatch:

https://forum.enterprisedna.co/t/the-ultimate-budget-allocation-methodology-for-power-bi-analysis/4069

The second option is to allocate your fact table amounts daily via Power Query and then create a physical relationship between the calendar table and the fact table, which will now work fine for time intelligence because both are operating at a daily granularity.

You are in luck here, since Enterprise DNA Expert @haroonali1000 just ran a Problem of the Week exercise dealing with this exact same issue. I would refer you to this thread, where he explains the problem and then later provides a detailed solution video breakdown.

That’s probably a lot to throw at you at once, so take some time to study these issues, and give a shout back if you have any follow-up questions. As I said, I think you are on a very good track here and with some additional effort will end up with a very powerful data model.

I hope this is helpful.

– Brian

1 Like

@BrianJ
your feedback above … “the much bigger issue here is that you have a granularity mismatch between your calendar table and your fact table”…

A follow up question:
I have spent time reviewing “The ultimate budget allocation methodology for PowerBI Analysis” you recommended.

Given that:
The date for our FYMonthEnd is not the same date of the month each year
The DATES table has a field for FYMonthEnd
The Fact tables for our existing High Level Management Financial reports are all based on FYMonthEnd date
None of the FACT Tables have a daily date, the ONLY date field they have is the FYMonthEnd field
Fact Tables include data such as: Revenue, Budgets, Costs, Profits, Net Rev, Effective Multipliers, Rev per Staff… etc

Question:
If all tables, including DATES table, have a FYMonthEnd date, is it safe to just change my current table relationship
FROM:
DATE TABLE: “DATE” Field to FACT TABLE “FYMonthEnd” field
TO:
DATE TABLE: “FYMonthEnd” Field to FACT TABLE “FYMonthEnd” field

It appears this would create a Many to Many relationship, maybe I could create a Table with JUST FY Columns?

As always I appreciate your feedback and consideration

Dave