Problem of the Week #4 (PQ) - Addressing Granularity Issues

From @haroonali1000:

OK, here we go! Problem of the Week #4 is now live!

For background on this initiative, check out this post and this week’s launch video
that Brian and I did on YouTube.

Problem of the week #4

First Challenges and now problem of the week!! Don’t worry it’s just a quick guest appearance.

So this week’s problem of the week was something I was tackling back in November and while chatting it through with the Oracle (@BrianJ) he said it would make for a great problem of the week so here it is…

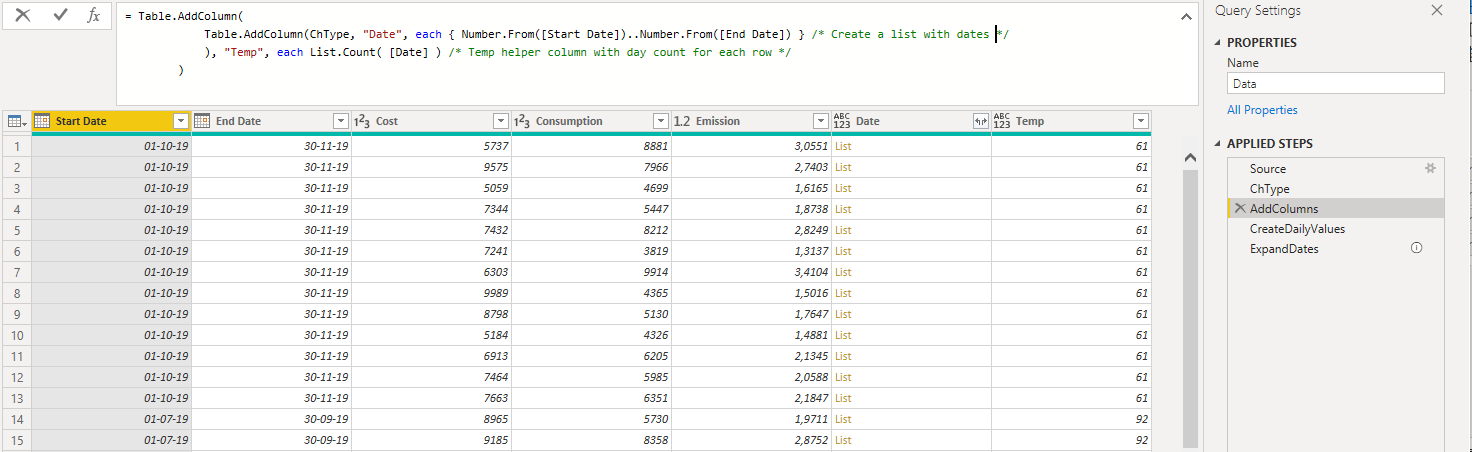
Granularity is a common issue we need to be able to handle, and in industry it’s common to practice to receive a mumble jumble of daily, yearly and monthly figures (common in finance, billing cycles etc).

So we all know that as a general guideline, any transformations that can be done in Power Query, should be done in Power Query. There are number of methods available in DAX, so this week’s calling is to complete this challenge using only Power Query.

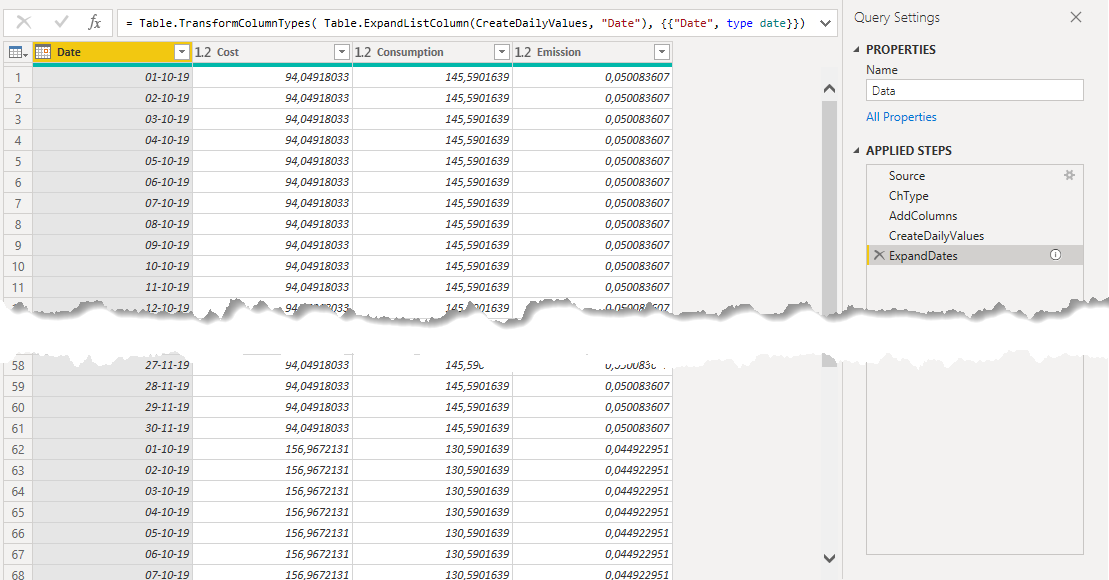
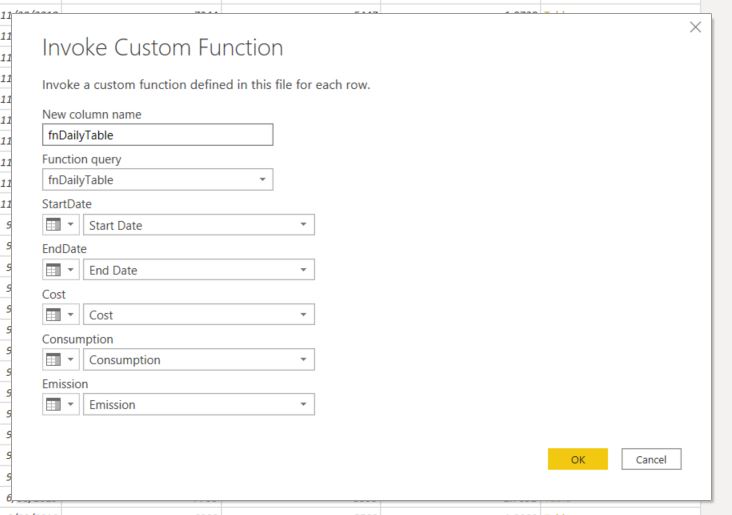
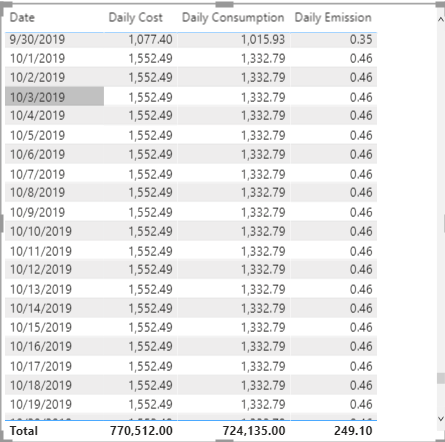
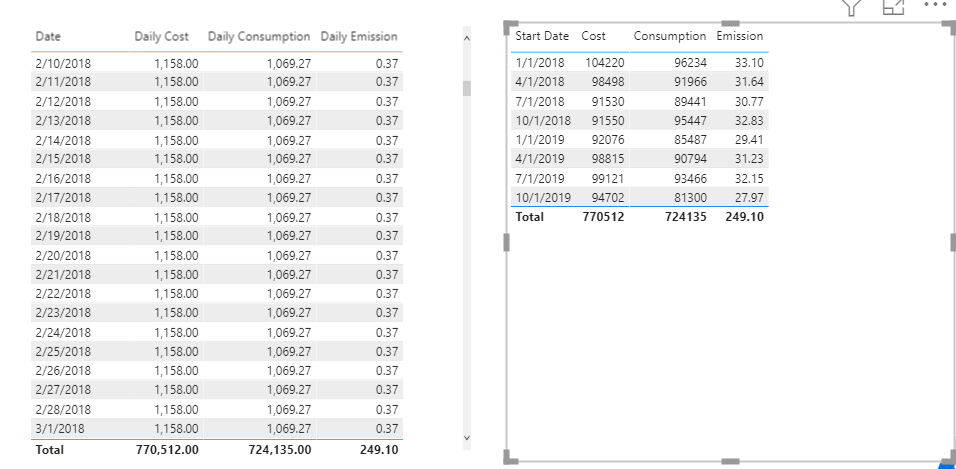
The ask is to take the monthly aggregated data and create a fact of daily granularity. I have shown below in a logical manner the result we want to achieve.

So taking the row below as an example:
image

The end result for this row would be as follows.

image

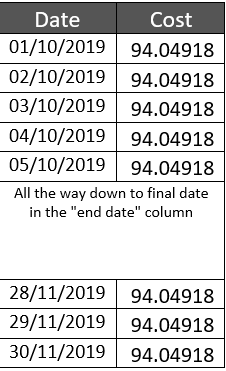
Final table should consist of the following columns: Date, Cost, Consumption, Emission
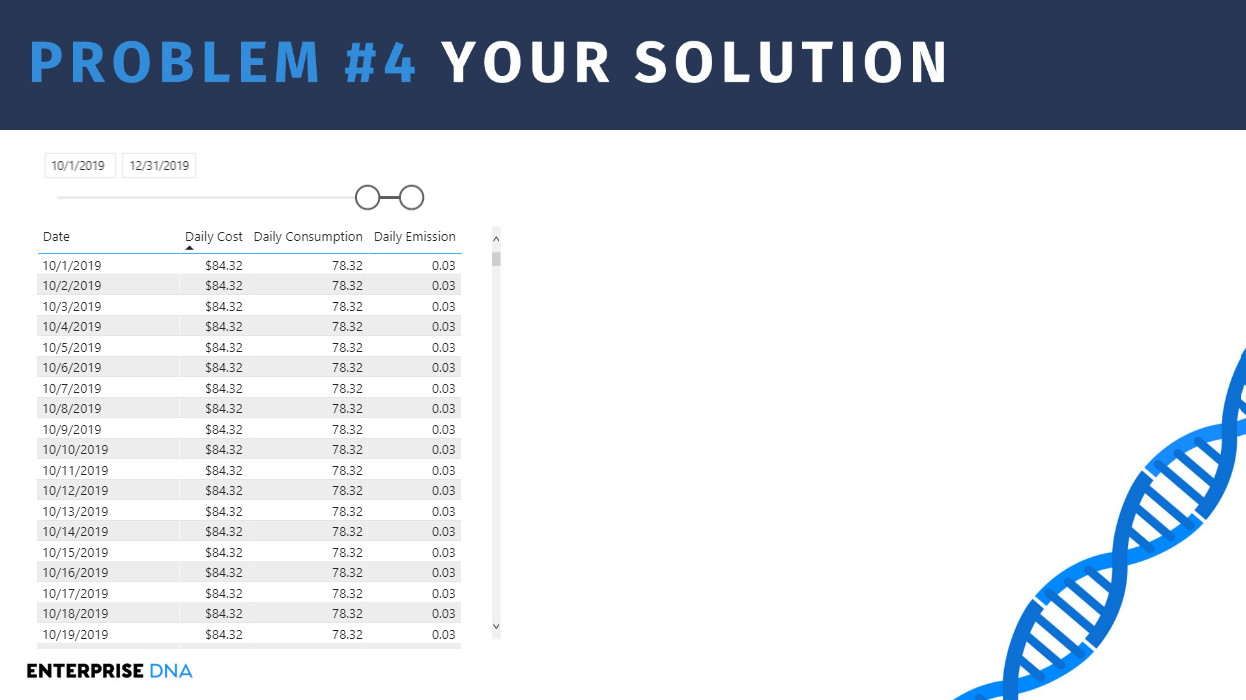
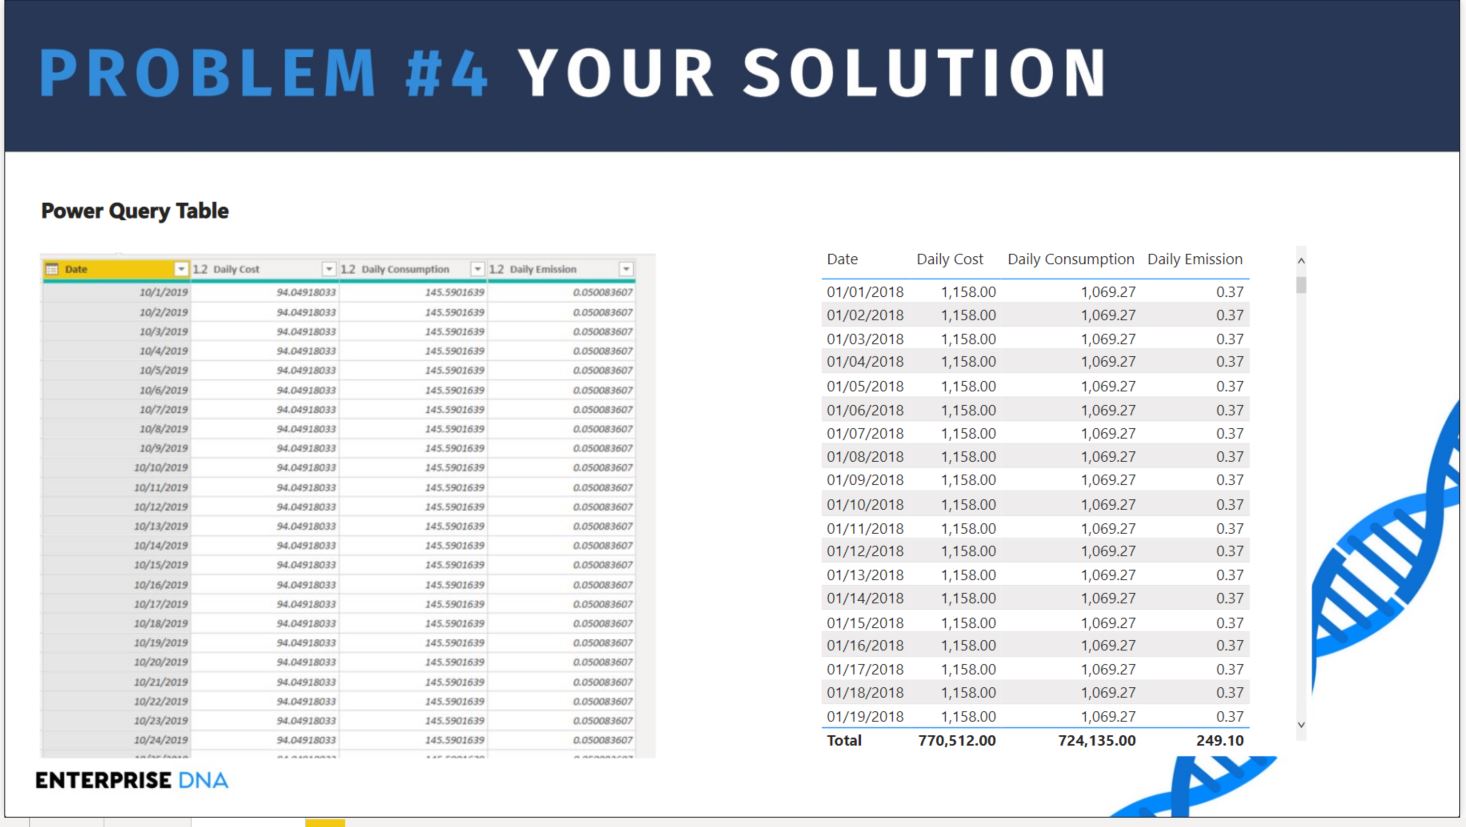
That’s all you have to do. :blush:

Over to you and good luck, looking forward to reviewing your solutions.

Any questions do not hesitate to shout.

Important
We ask that if you post anything directly related to a solution to please use the “Hide Details” or “Blur Spoiler” options within your post. This will prevent people who have not yet completed their solution from seeing things they might not want to see yet and could influence their solution.

To use these options, just select the text or image you want to hide, click on the gear icon on the top right at the top of your post and select either Hide Details or Blur Spoiler.

image

Note that this is a Power Query only challenge, so no DAX even if that is what you would choose to use outside of this challenge.

Eligibility for the Drawing
To encourage participation, we will be doing a drawing of five random participants each round to receive one of these cool Enterprise DNA vinyl laptop stickers:

image

To be eligible for the drawing, just send an email to problemoftheweek@enterprisedna.co before 11:59pm ET, Tuesday, January 26th, 2021 indicating you’ve successfully completed the challenge, and please provide your mailing address for us to send the sticker if you’re selected.

We hope you find this initiative fun, challenging and helpful in continuing to build your Power BI skills. All of the information you will need is contained in the files within this post. If you have any questions or comments, just message @BrianJ or @haroonali1000 in this forum thread.

Best of luck!!!

Haroon

P.S. Your feedback is always welcome, and if you have a real-world problem that you think might make a good future Problem of the Week, please email it to us at problemoftheweek@enterprisedna.co.
Thanks!

POTW #4 Final.pbix (492.1 KB)

6 Likes

@BrianJ

My submission attached.

Summary

POTW #4 Final - Stephen Maguire.pbix (497.6 KB)

3 Likes

Hi @BrianJ,

Please find attached solution, at the PQ level the values are matching but at report level it’s not as it aggregate the value for the particular date.

Thanks
Mukesh

2 Likes

Hi @samaguire,

If you check at PQ the values will match and it will not once you place that into report because the date is aggregating the values for entire row of that date. I too got same result which I believe is correct as the total for the problem and solutions are matching.

image

Thanks
Mukesh

4 Likes

Thanks @MK3010

I was more wondering if the data was correct:

I’ve adjusted my code to match as I can see that Brians screen clip of the source data in the PBIX file includes multiple rows per period.

1 Like

@samaguire, @MK3010,

Nicely done guys. You made quick work of this one using an almost identical approach. Also the approach that I used - a level of consistency we haven’t seen so far in Problem of the Week.

I’m sure @haroonali1000 will weigh in on your question re: the rollup aggregation, but I don’t think he intended that to be a key part of the problem – I think he wanted to keep the focus on the breakdown into daily granularity. In terms of the table visual you can turn the date rollup off simply by setting the daily cost to “do not summarize”.

Thanks to both of you for your participation – nice to see folks jumping on these right out of the starting blocks.

  • Brian
1 Like

Hi @haroonali1000,

:thinking: Common problem indeed…
Here’s my solution. POTW #4 Addressing Granularity by Melissa.pbix (499.5 KB)

How I worked through this POTW

So I think there are a number of ways to solve this but expect the general approach will be quite similar across all. We’ll have to wait and see if there are any out of the box versions among them…

Here’s what I did.
To calculate daily values, you first need to know what number of days there are in each period.

Then you can update each column value with Table.ReplaceValue

And finally expand the list with Dates

I’ve deliberately “written” more M, bringing steps together. However if you examine the code more closely it’s more accurate to state that I copied and pasted repeating patterns and/or nested steps generated by the UI because why write M if you can have the UI do most of that work for you :wink:

4 Likes

@Melissa,

Thanks! As always, some interesting wrinkles in your solution and things we can explore and learn from.

– Brian

Thanks Haroon for the problem.

Steps and solution below.

Have a good week.

Chris

Summary

It looks like I have taken a similar approach to others:

  1. Calculate number of days
  2. Divide rolled up values by number of days - Melissa appears to have written fewer code steps by using Replace.Value rather than separate Custom Columns, but the outcome is the same.
  3. List out all of the dates in the period - I used a List.Date function to do this.

I have dealt with the issue of the report view consolidating daily figures by adding an Index column. I also added an index on the source data before splitting up the daily figures as I can imagine cases where you would put the original data back together again in DAX - but it is not used here.

POTW #4 - ChrisH solution.pbix (589.7 KB)

3 Likes

Please find attached my solution for Problem of the Week.

POTW #4 @SueBayes.pbix (509.0 KB)

3 Likes

@Sue, @chrish,

Nicely done – Chris took the common path, Sue took a road less traveled so far – both work equally well.

Thanks for participating!

– Brian

1 Like

@BrianJ

Here is my Solution

Summary

POTW #4 Final - Rajesh.pbix (496.5 KB)

3 Likes

@Rajesh,

Thanks - always look forward to your solutions. You and @Sue took the same road.

  • Brian
1 Like

Hi @Rajesh,

I’ve seen you do this a number of times now and it’s almost as if you’re hooked on using the #table construct to built out your logic within nested tables… in this case too and it works like a charm.
Is there a specific reason you prefer this method?

View details

Table.AddColumn( #"No. Of Days", "Custom", each 
  #table(
    {"Date", "Cost", "Consumption", "Emission"},
    {
      {
        {Number.From([Start Date]) .. Number.From([End Date])},
        [Cost] / [No.Of Days],
        [Consumption] / [No.Of Days],
        [Emission] / [No.Of Days]
      }
    }
  )
)

Thanks!

2 Likes

It’s very elegant :slightly_smiling_face:

Thanks @BrianJ

Thanks @Melissa

There is no specific reason. Using #table we can get all the required columns in one step.

2 Likes

Here goes my solution for the Week-04. :+1:

Sorry guys, I missed delivering the Week-03 challenge on time as I was quite busy for the last two weeks but, hey, that’s on my To-Do list and I will soon deliver that too. :grin:

I’m really enjoying the challenges and can’t afford to lose a week and I think it’s always better to be late than never. :blush:

2 Likes

@quantumudit,

Great to have you back - we missed you in POTW #3.

You raise a great point about going back and doing the problem(s) you might have missed. We all have competing work, family, and other personal committments that sometimes make it difficult or impossible to participate in events like Data Challenges or POTW at the time they’re happening.

This is why we’ve set up a separate section on the portal for all the Problem of the Week intro and solution videos:

and a Problem of the Week topic on the forum, where you can find all the files and posts, organized by week/problem:

https://forum.enterprisedna.co/c/problem-of-the-week/51

So, if any of you find yourself in the midst of a tough stretch, just know that Problem of the Week will be waiting patiently for you when you get back. :wink:

Note also that this serves as a great reference archive - just this week on the forum there have been a number of posts about budget data granularity, where the techniques we’re discussing in POTW #4 would be highly relvant.

  • Brian
1 Like

Hi @BrianJ @haroonali1000, this is my solution for the PW-04.

3 Likes