@annamarie,
Welcome to the forum – great to have you here!
With regard to your question, I would strongly advise against doing anything except for the most basic statistical analysis via DAX. It’s certainly possible to do what you want to do with DAX, but it’s akin to building a house with a Swiss Army knife - you will have to build the test statistics manually, as well as the critical value and p value lookups, as well as the comparison measure between the test statistic and critical value. Here’s what that looks like based on code from the Microsoft Community:
Paired t-test in DAX
Summary
Significance =
//We first extend our sample data, but filter out missing Score2 data. We add a difference column and a difference^2 column
VAR _tmpTableForT = ADDCOLUMNS(FILTER(PairedT, ISERROR(PairedT[Score2]) = FALSE),
    "Diff", PairedT[Score1] - PairedT[Score2],
    "DiffSQ", (PairedT[Score1] - PairedT[Score2])^2)

//We create a few variables that make calculating the T-value easier.
VAR sumDiff = SUMX(_tmpTableForT, [Diff])
VAR sumDiffSQ = SUMX(_tmpTableForT, [DiffSQ])
VAR sumDiffColSQ = sumDiff^2
VAR N = COUNTROWS(_tmpTableForT)

//We calculate the T_Score
VAR T_nominator = sumDiff/N
VAR T_denominator = SQRT((sumDiffSQ - (sumDiffColSQ / N)) / ((N-1)*N))
VAR T_Score = ABS(T_nominator/T_denominator)

//We lookup the T-value of the three significance levels. First we assess the row to compare against based on N-1
VAR deg = SWITCH(TRUE(),
    N-1 <= 30, N-1,
    N-1 <= 45, 30,
    N-1 <= 90, 60,
    N-1 <= 560, 120,
    1000)
VAR T_0_05 = LOOKUPVALUE(T_Table[Sig_0.05], T_Table[DegreesOfFreedom], deg)
VAR T_0_01 = LOOKUPVALUE(T_Table[Sig_0.01], T_Table[DegreesOfFreedom], deg)
VAR T_0_001 = LOOKUPVALUE(T_Table[Sig_0.001], T_Table[DegreesOfFreedom], deg)

//If the T_score  is bigger than the T_sig, then it is at least that significance level. So, if T_score < T_0_05, it is not significant. If T_Score > T_0_001, then significance is  ***
VAR result = SWITCH(TRUE(),
    T_Score > T_0_001, "*** p=0.001",
    T_Score > T_0_01, "** p=0.01",
    T_Score > T_0_05, "* p=0.05",
    "Not significant")
RETURN
result
```
[/details]
The great news is that Power Bi integrates beautifully with R, and you can run R scripts and visualizations easily within PBI.
By comparison, what it takes DAX nearly 40 lines to do, R does better in 2 lines of code:
Compute t-test
res ← t.test(before, after, paired = TRUE)
res
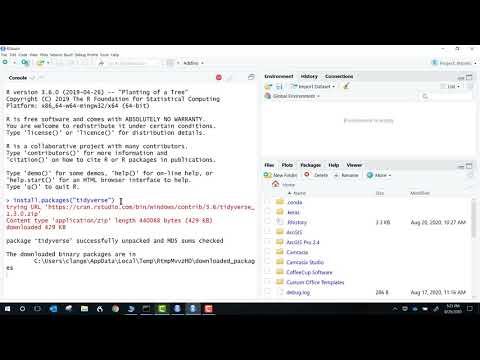
It takes a liittle bit of work up front to install R, R Studio (a fantastic free IDE for R used by almost every R user) and Tidyverse, a compilation of some of the best/most popular R add-on packages for data import, cleaning/manipulation, output and visualization. I’ve put together some links below for you on how to get set up, and also how to script out your t-test analyses.
While it’s possible to do very powerful data cleaning/prep in R, typically what I do is prep my data in Power Query/M, and write my R scripts to do statistical analysis in R Studio, and then run the scripts from within Power Query. There’s a good simple example of this in the 3-Minute Tips video I linked to below.
Installing R and R studio
Installing Tidyverse Package in R
Writing T-Test Scripts in R
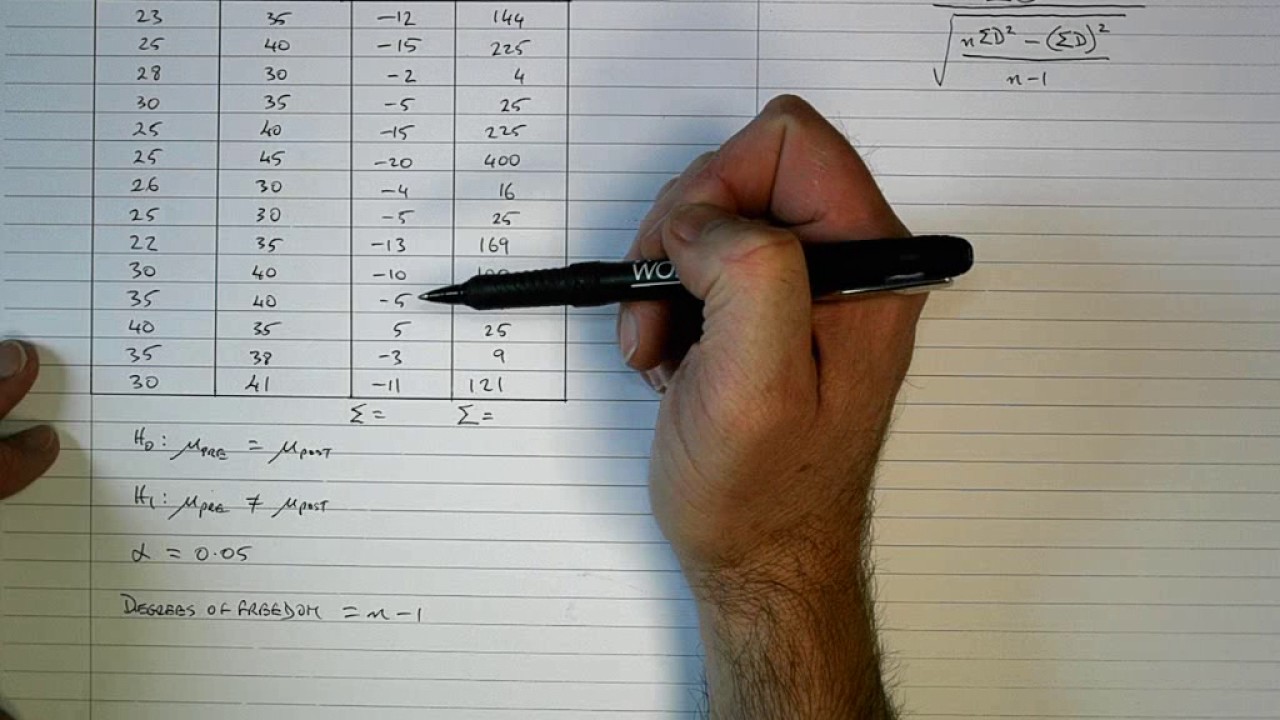
Conducting Paired T-Tests in R
Running R Scripts in Power Bi
I hope this is helpful. Feel free to give a shout if you have any additional questions.


