Getting Started with R (arrrh) // BoxPlots

Hello,

Recently I posted a thread about visualising my data in the form of an individual value plot. After a lot of talking (and @BrianJ inadvertently nudging me along :slight_smile: ) I sat down this afternoon ready to take the plunge into the deep dark waters of the unknown - R. Not only R, but R and power bi.

In the Microsoft tutorial Create an R-powered Power BI visual it lists these prerequisites:

image

Question 1:
Is it true that you can only use R visuals if you have a power bi pro account?

Question 2:
Edit: Not to worry, I found the answer here
There are two versions of R to choose from, the Microsoft flavour (Revolution Open download page) and then the normal flavour - from CPAN. Does it matter which one I choose? And if so, what is the difference?

Question 3:
Not that I know anything about R (yet), but I’m guessing I’m going to need an IDE. Does anyone have any strong preference as which to use? Or it as obvious as just going with R-Studio?

Now, after a lot of dithering, I found two strong candidates for my individual values plots.

  1. Use R, and a boxplot from the R plotly package
    (the pic actually comes from the python plotly package but the same seems available for R)
    image

Or,

  1. Use R, and a boxplot using the packages ggplot2, tidyverse, hrbrthemes, viridis

Question 4:
Since I cannot find the hrbrthemes library in the official list of supported R packages for power bi. Is it safe to conclude that (2) is in fact then not an option for me?

Question 5:
I am obviously hitting analysis paralysis here in my procrastination to jumping into the water. Does anyone who has trodden this path before me, have a nice gentle tutorial to get me to the point where I can visualise (1) or (2) above? As in, what to install for R. How to install the packages. How to get it into power bi. How to connect to my data model.

Sorry to ask for so much support here, but I am becoming more and more daunted by this exercise.

Looking forward to a reply
Michelle

@michellepace Regarding 3 - Nothing beats R Studio as an IDE for R as far as I know but Jupyter Notebook/Lab has cell mode which allows you to execute code step by step and see the result.

Example of Jupter Lab(with Python code):

Regarding 5 - Get a course on Udemy. Jose Portilla and Kiril Eremenko have courses that are 5 star in quality and will get you started in no time. And YouTube already has tons of great tutorials.

3 Likes

Thank you Antriksh and happy new year!

(Rstudio instaled!) … and on an unrelated note I’ve set my endless pieces of papers down, thrown OneNote out and signed up for a blissful year of EverNote. Hooray happy Christmas to me :slightly_smiling_face::slightly_smiling_face::slightly_smiling_face:

… with a sprinkle of whimsical :slightly_smiling_face:

2 Likes

@michellepace,

I know this may look daunting, but honestly with just a little bit of prep work it’s truly not difficult.

For basic package install instructions and execution of R scripts within Power BI, check out this post I made a few days ago (ignore the t-test information):

In terms of versions and IDE, I would definitely say for now go with the standard CRAN version and R Studio. That is the configuration that the vast percentage of users employ, and unless you are running huge datasets should be fine for your purposes.

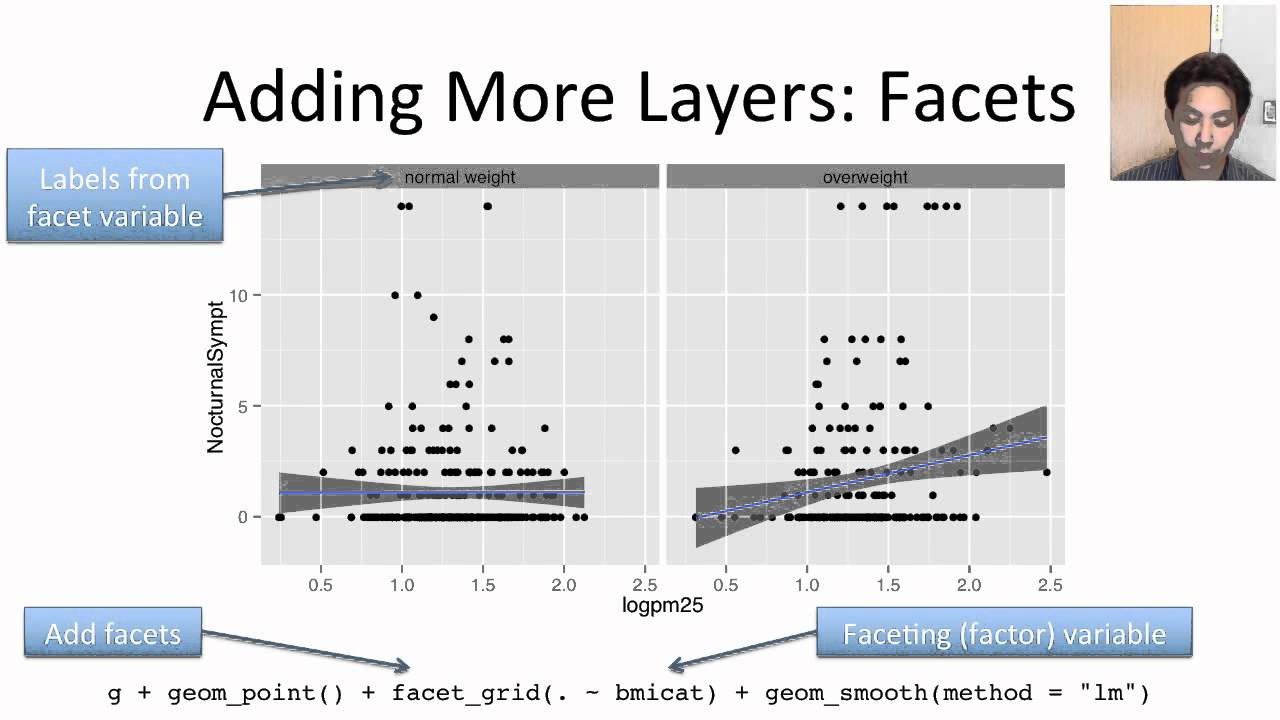
In terms of ggpplot2, here are a couple of videos I really like. Roger Peng’s is not interactive, but he does a really good job explaining the theory behind how R visuals are structured via ggplot2. The second video is highly interactive, showing exactly how to build the different layers of a ggplot2 visual using the famous Titanic dataset.

The beauty of this is that once you understand the general structure, every visual you build in R is done exactly the same way – it’s just a matter of filling in the blanks for the specific look you want to achieve.

For your boxplot/jitterplot visual, the hbrthemes package is not at all critical – it does spell check and some typology stuff, but you can totally produce that visualization without it.

One of the great thing about going from Power BI to R is that you don’t need to learn hardly any of the data prep functionality within R. You can do it almost all within Power Query, and then just call the current query via the dataset variable (see the Benford post I did last week for an example, and I can help you with this when you get to this point if you need assistance).

I hope this is helpful. I know it looks daunting, but trust me once you get into it much of the mystery will evaporate and you’ll see that it is really fairly simple – in my opinion, much easier than learning Power BI. And once you do learn it, it expands your Power BI toolkit dramatically, both in terms of analyses you can do and the almost infinite catalog of visualizations available to you.

I’m currently working on putting all of this into an Enterprise DNA Portal course on basic R specifically for Power BI users, as part of the amazing slate of content we’ll be rolling out each month of 2021 (more on this to follow soon…)

Give this a go, and you know where to find us if you run into problems. :wink:

– Brian

P.S. Two side effects of learning ggplot2:

  1. once you understand the basic structure of gglplot2, it also really helps you understand how to use almost package within R, since they typicall all follow the same general structure of Function(Object, Options…)
  2. once you get used to using R Studio, you likely will get super mad about how bad the DAX and M development environments in Power BI are, at least until TE3 comes out…
2 Likes

Happy New Year to you too! :partying_face:

I just installed to check how good is it, I have to say I am impressed, that code block functionality alone is extremely useful for me.

The handwriting recognition is awesome, even with a mouse it looks like I wrote it with pen.

Thanks Brian and Antriksh, where would I be without this forum. Brian, I’m going to follow your steps and make little notes as I go along with the gotchas I get stuck on. I’ll get them to you in the hope it may be of some use to you for the intro course.

Right gentlemen, see you on the other side of the new year!

That is a very impressive Father Christmas! :slightly_smiling_face::slightly_smiling_face:

Warm wishes.
Michelle

Michelle,

Great idea - documenting your issues will be extremely helpful in identifying topics/questions that I will need to address in the course.

And in terms of @Antriksh’s artistic capabilities, on this final day of 2020 I feel the need to resurrect my favorite post this past year – his representation of his relative power query and DAX skills in the form of an …unusual horse.

Happy New Year! See you in 2021…

  • Brian