Hi All,
I am trying to figure out the performance issue that P&L table is creating. I have also attached the screenshot of the Dax studio. It also refers to adding missing items, not sure what that might be? The query time is taking very long as well.
Are you able to shed light on how I may be able to fix this & improve the performance?
Thanks in advance for your help.
Abdul
Welcome to the forum @abdul.ali 
While waiting for other members to jump in, I suggest using the forum search to discover if your query has been asked before by another member. Thanks!
1 Like
It’s around 20k rows with 4 columns. The rest of the measures on same data work fine. There seems to be a disconnect in the mapping model which I don’t seem to figure out & hence I posted Dax studio screenshot. Thanks for the help.
@abdul.ali Looks like you are using this option? Plus there are a lot of SE Queries, have you used DISTINCT in your code?
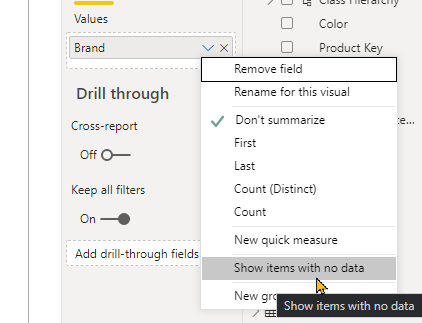
Thanks Antriksh. Yes I am using that item but it seems to be having no impact on timings if I switch it off. I need that to maintain the structure.
No there is no Distinct in the code. Below is the DAX I used.
Actuals =
VAR CurrentItem = SELECTEDVALUE('IS Template'[Items (Normalized)])

Return

SWITCH(TRUE(),

    CurrentItem = "Total Revenues", [Total Revenues],
    CurrentItem = "Total Operating Expenses", [Total Operating Expenses],
    CurrentItem = "EBITDA", [EBITDA],

    CALCULATE([TB Values],'P&L Mappings'[TB Items Mapping]=CurrentItem))
@abdul.ali Post the code of all the measures inside SWITCH(), and you also have other measures in the visual, try to find out the slowest one.
1 Like
Hi Abdul
I’ve been here in my role as Finance Director. The trick is to keep the SWITCH measure as short as possible, by;
- multiple mapping of ledger codes to totals as well as their own lines
- creating line references for numerators and denominators in the lines which require division (or any other KPI) then look the numbers up by expanding the context on a report structure table.
This way DAX can stay simple and for most of the time just add numbers up.
I answered a similar post a few weeks ago and gave a sample PBIX and excel structure of how I tackled this one to arrive at a star schema model. (see link below). FYI my measure kicked off a couple of years ago taking around 13 seconds to calculate. Now it’s less than 2 seconds. (Fact table 3 to 4 million rows; report table about 2500 rows, but then sliced for the relevant dept and business to around 50 rows displayed). All thanks to star schema and short SWITCH statement.
SWITCH function on Financial Reporting causing Resources Exceeded on PowerBI Web Service - DAX Calculations - Enterprise DNA Forum
Hope this helps
Pete
1 Like
It’s great to know that you are making progress with your query @abdul.ali.
Please don’t forget if your question has been answered within the forum it is important to mark your thread as ‘solved’.
We request you to kindly take time to answer the Enterprise DNA Forum User Experience Survey, We hope you’ll give your insights on how we can further improve the Support forum. Thanks!
1 Like
Many thanks @BINavPete , very useful. I’ll give this a try. So for each sub header I need to have a separate mapping column to be able to calculate the values ?
Yes
Usually ther will be a chart of accounts which has columns detailing the summarisation hierarchy. This will do much of the work but if the hierarchy is by Gross profit then product you won;t get a turnover number. Not a problem thought just extend the CoA and add the columns in.
Power query can then put the structure into a column table with unpivot and BOOM.
Pete
1 Like
