Hi EDNA members,
I had a look and took inspiration from @BINavPete idea in this thread and everything works fine.
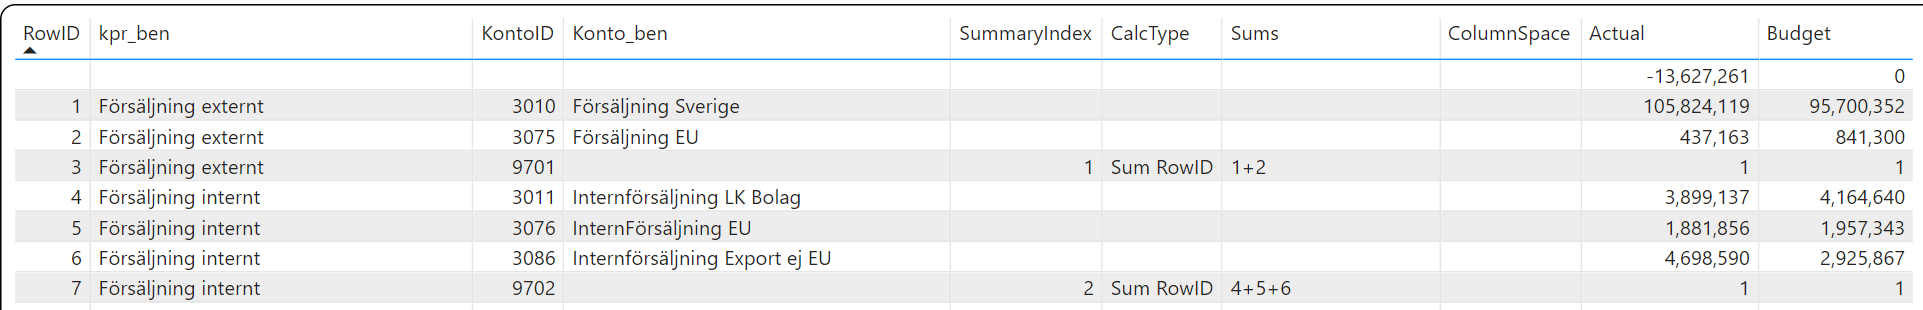
I still got one holdback and that is how to sum up specific rows to show the subtotal and total (in the end).
In the print screen below i have one RowID for each row and in this example on RowID 3 i want to sum the two previous rows which is 1 & 2 and then on RowID 7 i want to sum rows 4+5+6 etc.
Hey @Tibbie
Bättre om jag svarer på engelska. Det är länge sen jag bodde i Sverige.
I am on holiday this week but spotted this on my phone. So thought I’d give a quick response. If you need something longer get back in touch and I’ll respond at the weekend or next week.
You could handle your problem in a few ways.
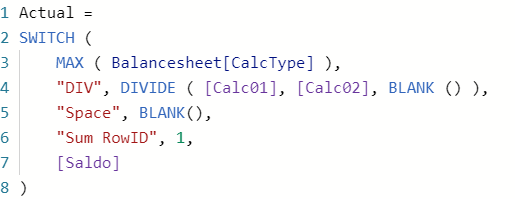
Firstly, you could put another option into the switch SUBTOT, calc01 + calc02 + calc03. Downside here is the subtotalling gets messy the more you add and the dax will slow down.
Alternatively you could check out the dax for cascading subtotals, these create a running total as the code flows through rowID. Dax would then have another option in the SWITCH to pick up the running total. If you Google dax cascading subtotals this should come up. If not look at P3 website.
My favoured approach is neither of these although I did try both in the early days of getting financials to work more quickly in dax.
The optimum option is to map the subtotals at source. So when the numbers come into power bi they are already in the fact table. I’m typing on an iPad and no idea how to get a table in here, but map rowID 1 to 3010, rowID 2 to 3075, then 2 rows for rowID 3 one with 3010 and one with 3075. Then with power query map the ledger amounts through this table and group them by rowID.
Then your existing measure will just work.
This seems a bit complex but means insertion of other row ids is easy and the dax code short. long switch statements do not perform too well.
Check out videos on financial statements in power bi at binavigation.com. These should help you optimise your model too.
This can be time consuming on initial setup but adds huge flexibility later.
@petesmith673 Hehe interesting hope you enjoyed your stay here and enjoy your vacation this week!
The only article i found was this one, link, from 2018 and it was really informative but it seems that a lot has happened in the PBI and DAX world since then (like the VAR option etc.)?
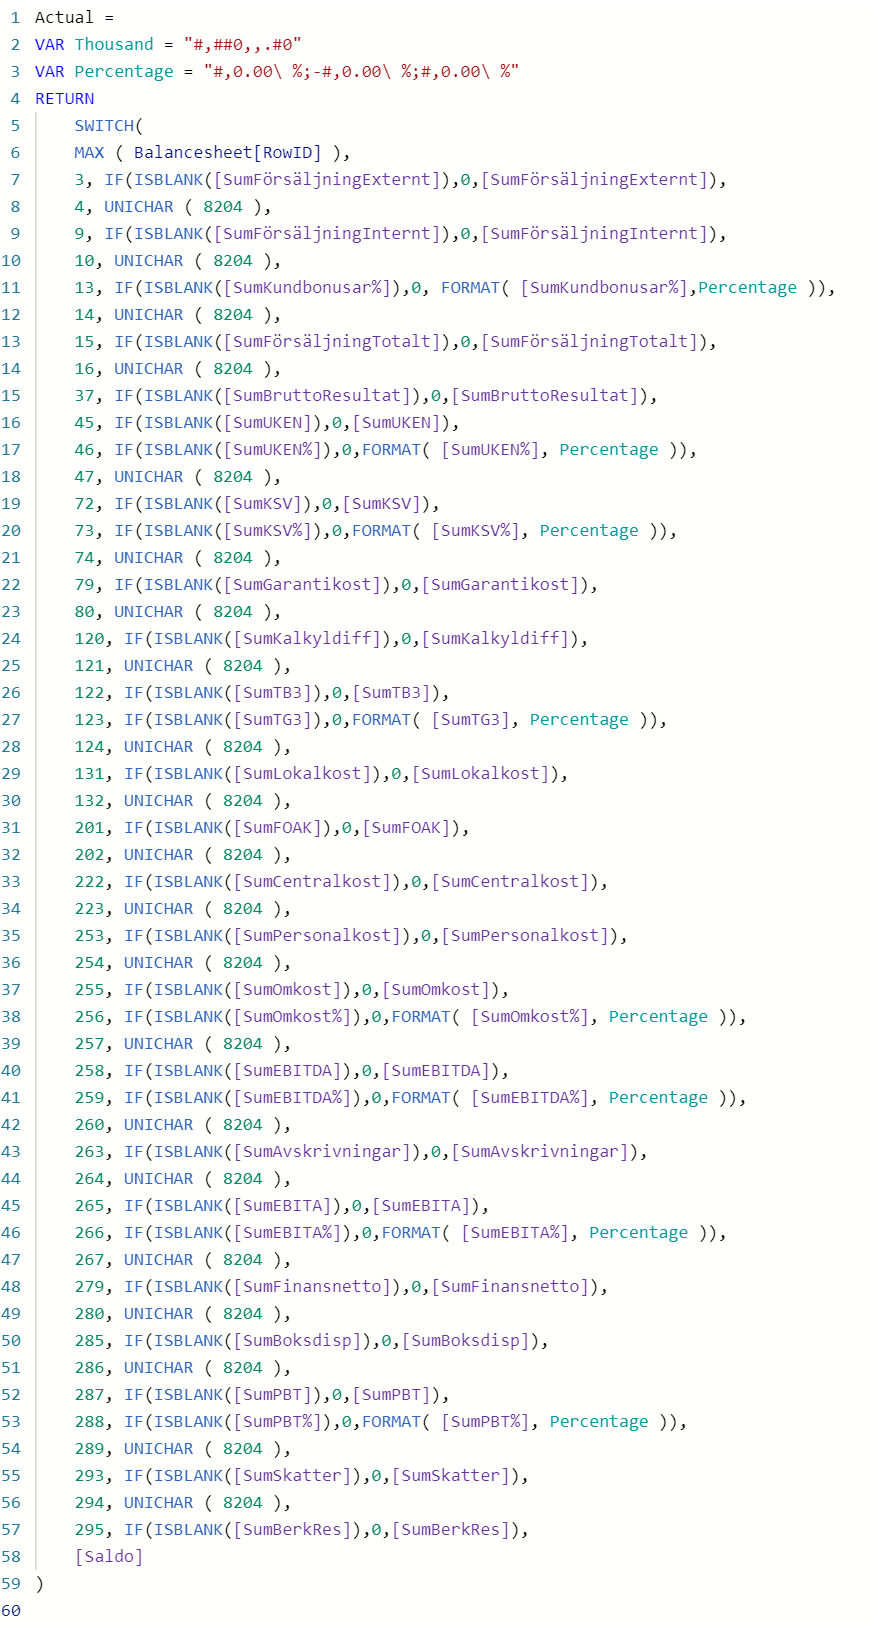
I made a more static approach which works but is far from best practice or nice since it cant be used in a matrix only in a table. I created individual measures for all the subtotals, totals and divisions and linked them by the row number inside the switch.
but this is just the working first draft that i needed to deliver so now i will work on a more dynamic approach which also will work in a matrix.
I watched all of the “Power BI – Income Statement Training Videos” from binavigation which describes the overall concept well so thanks for that! If you also have any .pbix file that i can take inspiration from that would be lovely!
Btw, the contact form on your site does not work for me so please provide your email.
Hej Tibbie
Been having issues with that contact form sine day one. Joys of word press. As well as the contact form there is an email address on the contact page.
When I first started shaping financials in dax I had a long switch just like you.
I found 2 issues - difficult to put a change thru if a row gets inserted into the structure. More importantly as you add more subtotals the whole thing grinds to a halt.
I haven’t got a template I can share as such because I want to sell my solution and want to protect my intellectual property. But I will download your pbix and reshape it to something that works for you.
Bra att jag kan lite svenska.
Har det bra på Helen
Pete
See attached PBIX and excel file.
I took the gross profit codes to explain the principles and you should be able to take this from there across your whole CoA. Tibbie.pbix (169.2 KB) Tibbie.xlsx (333.9 KB)
Excel File Chart of accounts is expanded to include a link to totals - GL01 to GL03.
So GL01 has 9707 in every row to mark up Gross Profit. GL02 and GL03 mark up the subtotals for sales and COS. I did it this way because you had already numbered the totals. If you look at Alternative CoA, this is how I would map it because it is then easier to find any errors. CoA Map is a power query in the excel file which unpivots the chart of accounts and maps the RowID. See how the ledger codes are repeated for each total. This could be done in the PBIX but I prefer to do it in Excel because once set up it is a static table and therefore your PBIX will refresh more quickly without the need to rebuild. Report details the structure of your report marking up a few spaces and applying a gross profit percent row35 / row13. It also has a signage marker. I find it easier to manage the signage here because the DAX will just use this column as one point of signage correction. DAX can get messy with a switch statement just to manage accounting signage. So easier to keep it static here.
Note that the rowID and Calc01 and Calc02 are excel formulae. This means that when you insert a row in the report structure the references will change dynamically and you just need to refresh COA Map to move on. Actuals and Budget are just copies of your data. I applied a Feb 28 date to the actuals for demo purposes but I guess this is cum data.
PBIX Fact table - rather than have separate fact tables for budget and actual, I have appended them into one marking the data budget or actual. This makes the DAX measure writing easier, quicker and helps with matrix functionality. Having appended the actuals and budget, the fact table PQ merges with the ChartofAccountsMap and grows to repeat the ledger code number and amount for each sub total and total. With a small number of rows in the fact table this is fine and even though a ledger code is repeated a lot the DAX manages it lightening fast.
From a purist perspective however one could rationalise this by grouping the fact table on RowID, Date and Stream. This would result in fewer rows.
I did leave rvkl_kst in the table. Not sure what this is but looks like it could be a dimension table. Date Table- copy of EDNA’s PQ generated date table. Reports - straight import from Excel Stream - 2 row table with budget and actual - makes DAX a bit easier.
DAX Measures
These are built on what you have already picked up from my earlier posts, so don’t need too much explanation.
Note the multiplication to manage the signage. In early development I manage spaces by applying 0.001 to a CalcType Space. Most visualisations can be formatted to show the 0.001 with same font and back colour to give appearance of blank.
Hello @Tibbie, it’s been a while since we got a response from you. In case there won’t be any activity on it in the next few days, we’ll be tagging this post as Solved.
Thank you so much for explaining everything and taking the time to help me out with this this task! Since this thread is solved I used the contact form on your website for further enquiries.