SWITCH function on Financial Reporting causing Resources Exceeded on PowerBI Web Service

Hi everyone,
I have the following issue. I created a measure using the SWITCH function similar to the one shown on the EDNA Course Financial Reporting w/PowerBI.
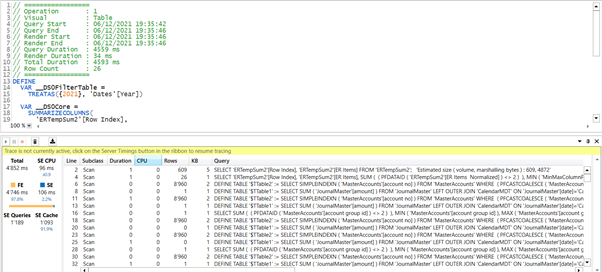
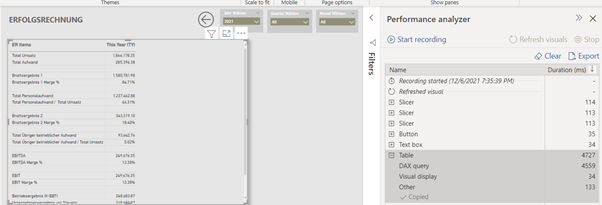
The table on PowerBI desktop takes a while to load but it works. However, when I upload the report to the PowerBI Web Service the table does not load and I’m getting the error message: “Resources Exceeded This visual has exceeded the available resources.”

Below is the syntax of the measure:

ER Selected Year Actual =
Var CurrentItem = SELECTEDVALUE( ERTempSum2[ER Items (Normalized)])

Var Result =
SWITCH( TRUE(),
CurrentItem = “Total Umsatz”, [Total Umsatz] ,
CurrentItem = “Total Aufwand”, [Total Aufwand] ,
CurrentItem = “Bruttoergebnis 1”, [Bruttoergebnis 1] ,
CurrentItem = “Bruttoergebnis 1 Marge %”, FORMAT( [Bruttoergebnis 1 Marge %], “0.00%” ) ,
CurrentItem = “Total Personalaufwand”,[Total Personalaufwand] ,
CurrentItem = “Total Personalaufwand / Total Umsatz”, FORMAT([Total Personalaufwand / Total Umsatz], “0.00%”) ,
CurrentItem = “Bruttoergebnis 2”, [Bruttoergebnis 2] ,
CurrentItem = “Bruttoergebnis 2 Marge %”, FORMAT([Bruttoergebnis 2 Marge %], “0.00%” ) ,
CurrentItem = “Total Übriger betrieblicher Aufwand”,[Total Übriger betrieblicher Aufwand],
CurrentItem = “Total Übriger betrieblicher Aufwand / Total Umsatz”, FORMAT([Total Übriger betrieblicher Aufwand / Total Umsatz] , “0.00%” ),
CurrentItem = “EBITDA”, [EBITDA] ,
CurrentItem = “EBITDA Marge %”, FORMAT( [EBITDA Marge %] , “0.00%” ) ,
CurrentItem = “Abschreibungen”, [Abschreibungen] ,
CurrentItem = “EBIT”, [EBIT] ,
CurrentItem = “EBIT Marge %”, FORMAT( [EBIT Marge %] , “0.00%” ) ,
CurrentItem = “Betriebsergebnis III (EBT)”, [Betriebsergebnis III (EBT)] ,
CurrentItem = “Unternehmensergebnis vor Steuern”,[Unternehmensergebnis vor Steuern] ,
CurrentItem = “Direkte Steuern”, [Direkte Steuern] ,
CurrentItem = “Jahresergebnis”, [Jahresergebnis] ,
BLANK()
)

RETURN
Result

I read the SWITCH function is an expensive function but it can be that the above measure requires so much memory or the problem lies somewhere else? I have a Pro Licence and the Error message says consumed memory 1024 MB, memory limit 1024 MB.

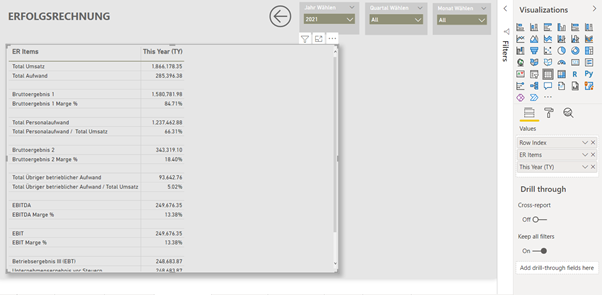
The report page has one table and the table has only this measure (please see screenshot attached).

I would really appreciate any inputs, suggestions or changes to the measure to make it more efficient. If indeed the measure consumes so much memory, is there another way/technique to recreate a P&L with aggregation lines, % of total, etc. without using the SWITCH function?

Thank you!
Mariano
PBI ER Page

@Mariano Run performance analyzer and use DAX Studio to find out how many queries are being executed, and then share the results here.

Thank you for your answer AntrikshSharma. I attaching you here the results from Performance Analyzer and DAX Studio Server Timing (both json files). I’m also attaching you the screenshots on how I have run the performance tests since I don’t really know if in DAX Studio I’ve done it correctly or how best to share the results. Any inputs are welcomed, thanks!

DAX Studio Server Timings (screenshot)
Performance Analyzer Result

DAX Studio Trace Details.json (3.3 MB)
PowerBIPerformanceData.json (8.3 KB)

@Mariano The image is blurred, do you have DISTINCTCOUNT function in measures? There are 1189 SE queries and most of the work is done by Formula Engine so this is going to be slow.

There are no DISTINCTCOUNT or any other expensive function that I know. All the measures are a variation of this:

Energie- und Entsorgungsaufwand =
CALCULATE (
[Actual],
AccountsMaster[account_no] >= 6400
&& AccountsMaster[account_no] <= 6465
)

Each measure aggregates a number of accounts from the accounts ledger. In total there are 39 measures including the total lines (e.g. Total Revenues, Total Profit, etc.).
I thought these are pretty easy functions for PBI to process. The dataset is also small (fact table is less than 12’000 lines). Thanks.

Hi @Mariano
Herzlichen Willkommen bei uns in Forum.

I’ve been here too. Rationalising a long SWITCH can be tricky. A PBIX upload would be helpful but think about the following.

It looks like your accounting data has already been transformed so that your fact table has sales costs and gross profit as separate numbers. Therefore there doesn’t appear to be a need to work out profit. This is a fantastic first step.

I think there are two things here:
Much of your SWITCH statement is based on division calculations. If you rationalise the DAX to look up the numerator and denominator in separate measures with a marker in the Erfolgsrechnung dimension table, you will only need one division line in the SWITCH.
Secondly, your fact table should contain the line descriptions. If it does then you can create a relationship between the fact and Erfolgsrechnung dimension table, then apply a simple sum measure for most of what you need.

End result will be a much shorter SWITCH and an optimised model.

If you share PBIX I’d be happy to work this thru.

Pete

Hi @BINavPete ,
Vielen Dank für deine Antwort!

I finally managed to create a PBIX version that I could share here (see attached).
ER_Example_Shared_EDNA.pbix (393.0 KB)

The tables that have biggest performance issues are on the tabs: ER Year Comp Sum1 and ER Year Comp Full

The accounting data is from the Accounting Ledger and has no aggregations (i.e. no total sales, no total gross profit, etc.). All the aggregations needed to done via measures. I used measure branching to make the code easy to follow; however, this might have had such a negative impact on performance?

As you rightly mentioned, there is one measure that calculates the % change between this year and previous year and within the SWITCH function there is a DIVIDE for each line. Taking out this measure from the visual shows some improvement in performance but even the measure that just calculates actual values for this year and previous year or the change in absolute value (i.e. no DIVIDE) seem to take lots of resources.

In general, the methodology that I used to create the P&L was the one shown by EDNA in one of their courses. If there is a more efficient way to create a “custom made” P&L without using much SWITCH, please do let me know.

Thank you so much for you help!
Mariano

Hi Mariano
See attached PBIX and XLSX. I have been exactly where you are. EDNAs financial showcase works really well with a limited number of KPIs and accounting lines and is where I started a couple of years ago. Now retired from finance offering Power Bi consultancy. Love the software that much. :slightly_smiling_face:

I cut and pasted your tables into the XLSX file and worked ERTempSum01 through to Bruttoergebnis2 Marge% to showcase the methodology.

  • Additional cols on ERTempsum1
    Calctype - blank to just add up numbers, DIV where a division takes place, Space to cater for 0 wherever there are spaces.
    Calc01 and calc02 - the numerator and denominator row numbers.

  • Additional cols on Accounts Master (ignore Lookup - just for me to understand the Chart of Accounts(CoA).
    The principle here is that everything in ERTempSum1 must map back to the CoA. Where that is not the case I have inserted additional cols. The end transformation in PQ uses these cols plus name_group to create the mapping for the relationship to work

  • I also amended the text here and there on ERTempSum1 to make the mapping work

Then I created a fresh PBIX

  • Took Journal Master and in PQ appended the Credit entries to the Debit entries and switched the signage on the credit entries. This means we only need one measure and no user relationships later.

  • Reworked AccountsMaster to put the extra mapping and name_group into a single column. This is the source of the relationship to ERTempSum1 later

  • Brought data into model and created pure star schema with relationships to ERTempSum1 ( this is one of the reasons your PBIX was running slowly)

  • Measure - Ledger Amount - straight forward.

  • Measure - Calc01 - by changing context with ALL, this will return the numerator element for a given row in ERTempSum1. Ditto Calc02 for the denominator.

  • Measure Actual - SWITCH statement looking at what is in CalcType Column, dividing where necessary. Space is also important here to ensure gaps appear in the report. By default they don’t because there is no relationship

  • Other measures straight forward
    EDNAData.xlsx (440.5 KB)
    EDNA.pbix (510.7 KB)

The key learning curve I came through was to map everything up in XL, make PQ do the hard work in manipulating the COA and the journal data. Then simple DAX measures make the thing run really quickly. My own SWITCH statement did have about 20 different calculations in it by utilising more than one Calc look up. But still ran quickly for a business with 50,000 ledger accounts, 10 business units, 60 depts and data going back 20 years!

As a final tip on your model I would just have a single ERSUM and put another column in it to categorise the other Summarisations. This will mean you can utilise the existing measures and place the categorisation on a slicer.

Hope this is helpful

Pete

2 Likes

Hi Pete,
That is really good, thank you so much!
Would be good to connect directly, perhaps we can collaborate together in the future.
What would be the best way to contact you?
Best,
Mariano

@BINavPete am in exact same situation at the moment with my model. Great tips

Happy to help @Suzie