Hi
This is probably a simple one for most of you but I have hit a serious mental block on how to do this.
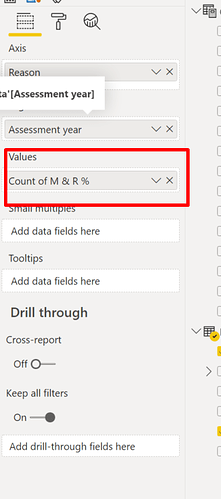
I have attached a PBI file and a PPT as well to demonstrate the issue. I want to create 2 graphs using the data from the table DATA. This table has 3 fields - Assessment Date *(which is a year - whole number format), M or R (showing whether its Mandatory or Recommendation) and the Reason field (this has 8 categories e.g. DOcumentation, SOftware, Equipment etc)
-
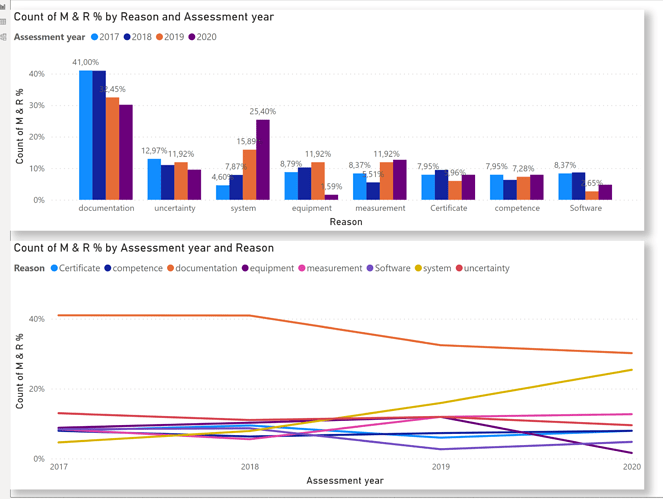
The first graph I want is a line graph in which the x-axis is the Assessment Year, the y-axis should show the count of Reason (using Reason as a legend i.e. there is a line for each reason type) . I can show it as a count by Reason type but I want to show it as a percentage of the total count of reasons for that year.
-
The second is a cluster chart grouped by the Reason type and sub-broken into a count by year (which is the legend in this case). Again I want to show a data label of % as a total count FOR THAT YEAR.
I have attached the PPT which shows the graphs in Excel.
I know this is probably very simple for you guys but I am completely stumped on this. ANy help will be greatly appreciated.
K
Sample.pbix (436.6 KB)
Example.pptx (114.0 KB)
ind regards
Prem


