In this post I received a revision of my original datamodel regarding information about Students, Schools and some variables describing the relationship between them (like the distance between the students residence and the school’s address).
The most relevant change to the datamodel was the transfer of the address columns from the Address table back to the Students table and the Schools table because they can be seen as rather stable aspects of Students and Schools and belong in their proper dimension table.
The reason for me to bring all addresses together in one table had to do with the fact that I want to show the geographic location of both Students and Schools in the same map visual. And the map visual does only allow for one column for latitude coordinates and one column for longitude coordinates.!
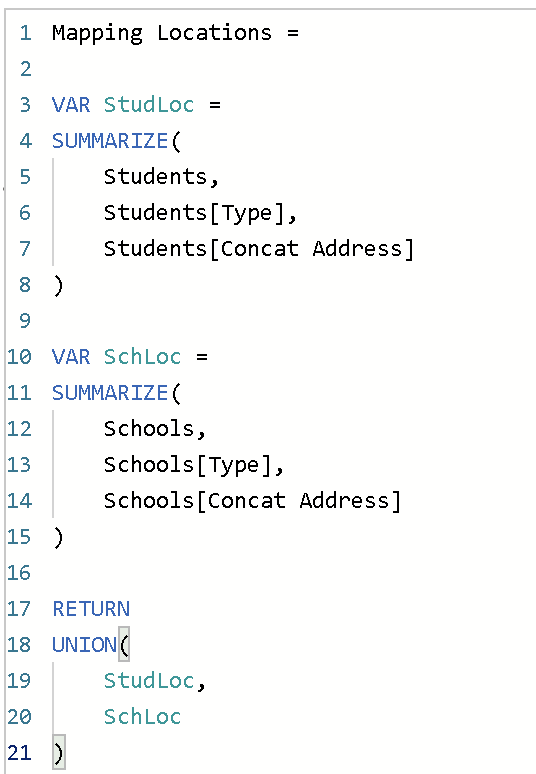
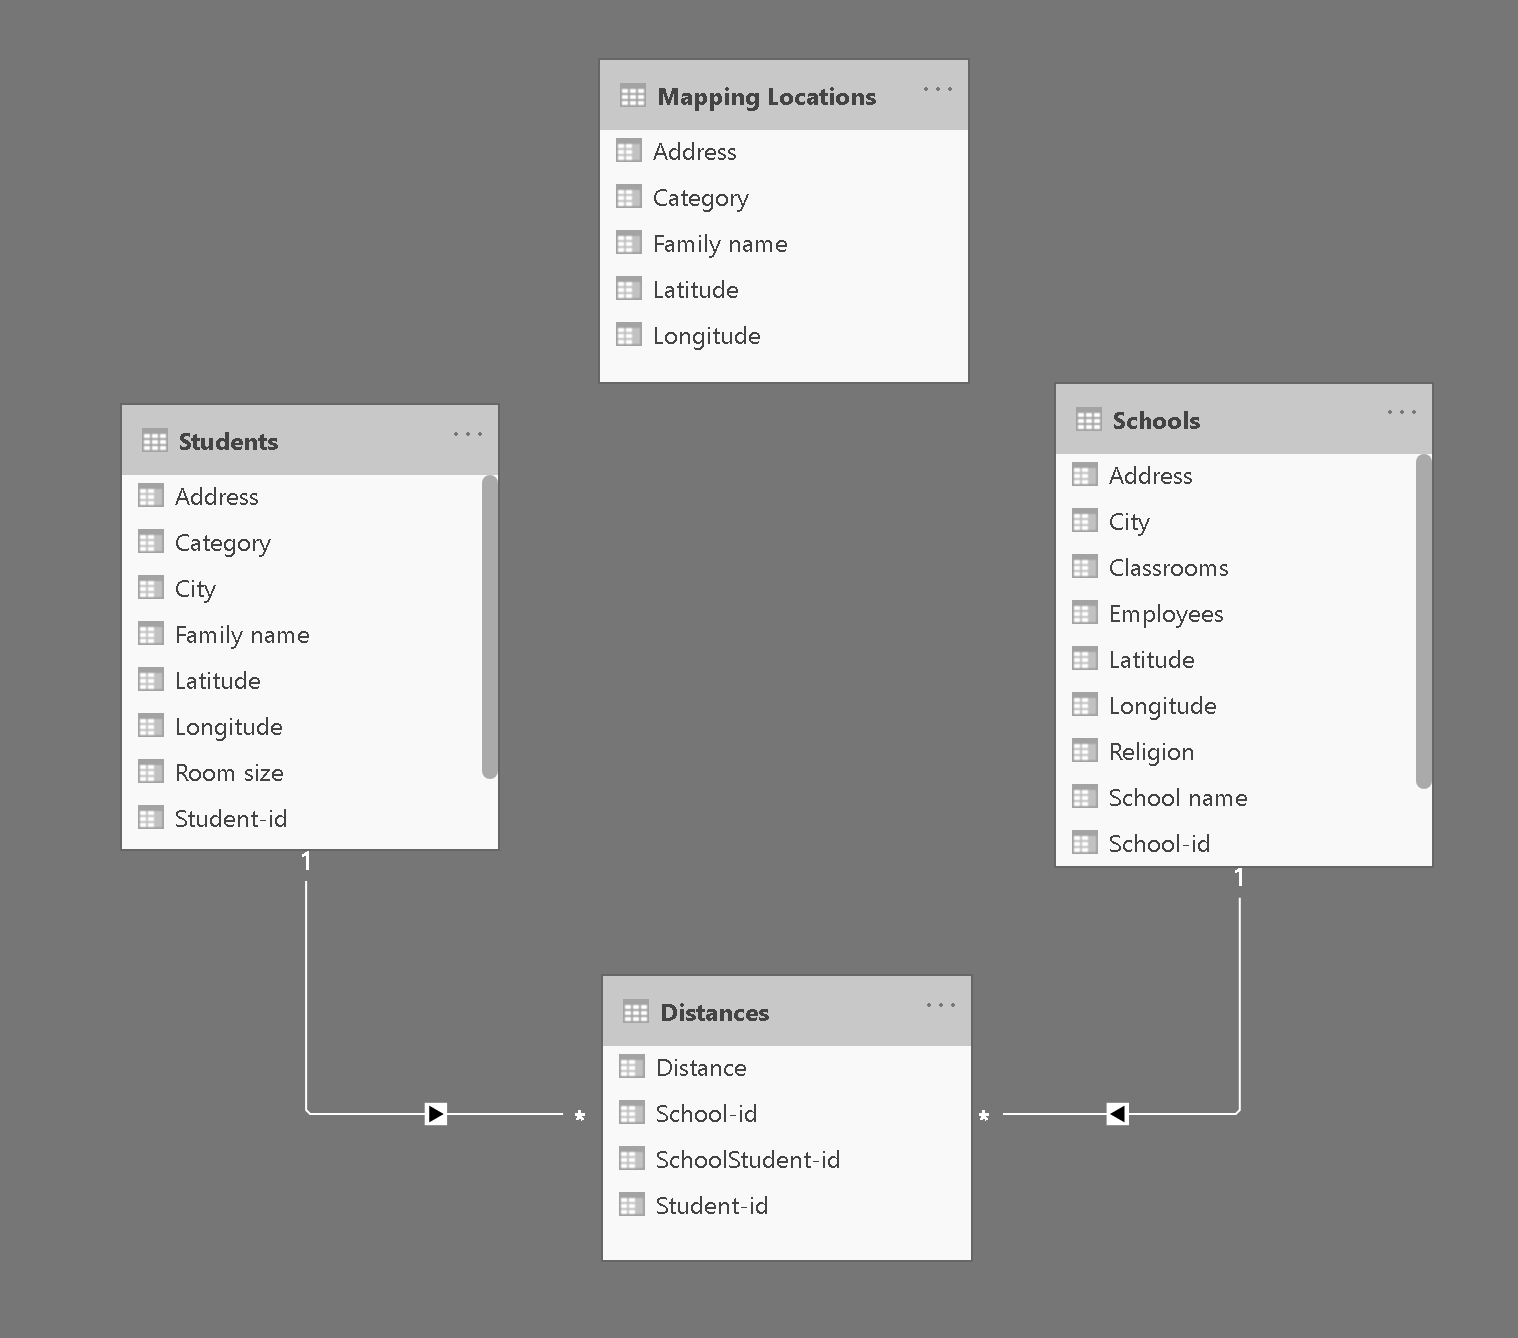
As explained in the same post, this can be solved by joining the address columns of the Students table and Schools table using DAX:
The resulting table can indeed be used to show the geographic locations of both students and schools in the same map visual. But on the same report page are also table and other visuals displaying information about the students and information about the schools and I want those visuals to interact with the map visual. So when the user selects a school in one of the visuals, the map visual will filter on that particular school and vice versa. I would say that such interaction would require to define a relation between the Mapping Locations table and the Student table and the School table, being a one to one relationship. That would bring me back closely to the original datamodel I started with and doesn’t fit the star scheme requirements.
What would be a proper solution for this situation?
My original misinterpretation about the meaning of the Values and Levels columns in your original data set notwithstanding, I think a data model along these lines would get you what you need in terms of the mapping requirements, while remaining consistent with the star schema design and avoiding the bidirectional relationships and connections between dimension tables that I saw as problematic in your original data model.
I have some difficulty to understand your solution as it’s a bit hard to look through the effect of the differently interpreted Values and Level. I therefore uncluttered the data model that we use as an example and try to fit in your suggestion. Unfortunately it remains unclear. Could you show your approach in the uncluttered version of the attached pbix?
Before I start reworking the structure into a revised data model, it would be very helpful to see a mockup of the tables/analyses/maps you want to create from it. Per my post below, I typically do this type of storyboarding before structuring my data models so that I can be sure the structure I come up with will support the analyses and visuals I ultimately want. While there are some very clearly wrong ways to model your data, there is not always one right or best way to do it - “right or best” are ultimately relative to what you want to do with the data - particularly in this case where there is not a typical fact table and some of the dimensions optimally could be combined or split out separately, depending on the end goals.
Once those objectives specified more explicitly, the “correct” data model usually becomes clear pretty quickly. I suspect you will see this dynamic play out in Data Challenge #3, where some participants will unpivot the interview data while others will maintain it in pivoted form, depending on how they want to analyze the data.
I hope this is helpful to you, even if not the clear-cut answer you were probably looking for.
Your point is more than clear and well known to me. The attached pbix already included a page with all relevant visuals to the question. They just don’t interact, because they need some additional relationships in the data model. I honestly don’t know how to bring more clarity to the question. There is no revised data model. It is the original data model. The one that I brought up in my initial posting.
When I started my original question regarding the drill through I came up with a data model that had some ambiguity in it. You pointed that out clearly and suggested to bring back the addresses to the original dimension tables (schools and students). You also created some additions regarding Values table, but I like to stay away from that, because it carried some misinterpretations in it.
To enable a map visual with all schools and students in it, you suggested to use DAX to create a Mapping Locations table. Fine. But in order to make that Map visual interact with other visuals it needs to be related. And when we relate the ID’s of every Mapping Location with it’s original Student-ID or School-ID we end up again with two one to one relationships and we’re back to were we started originally.
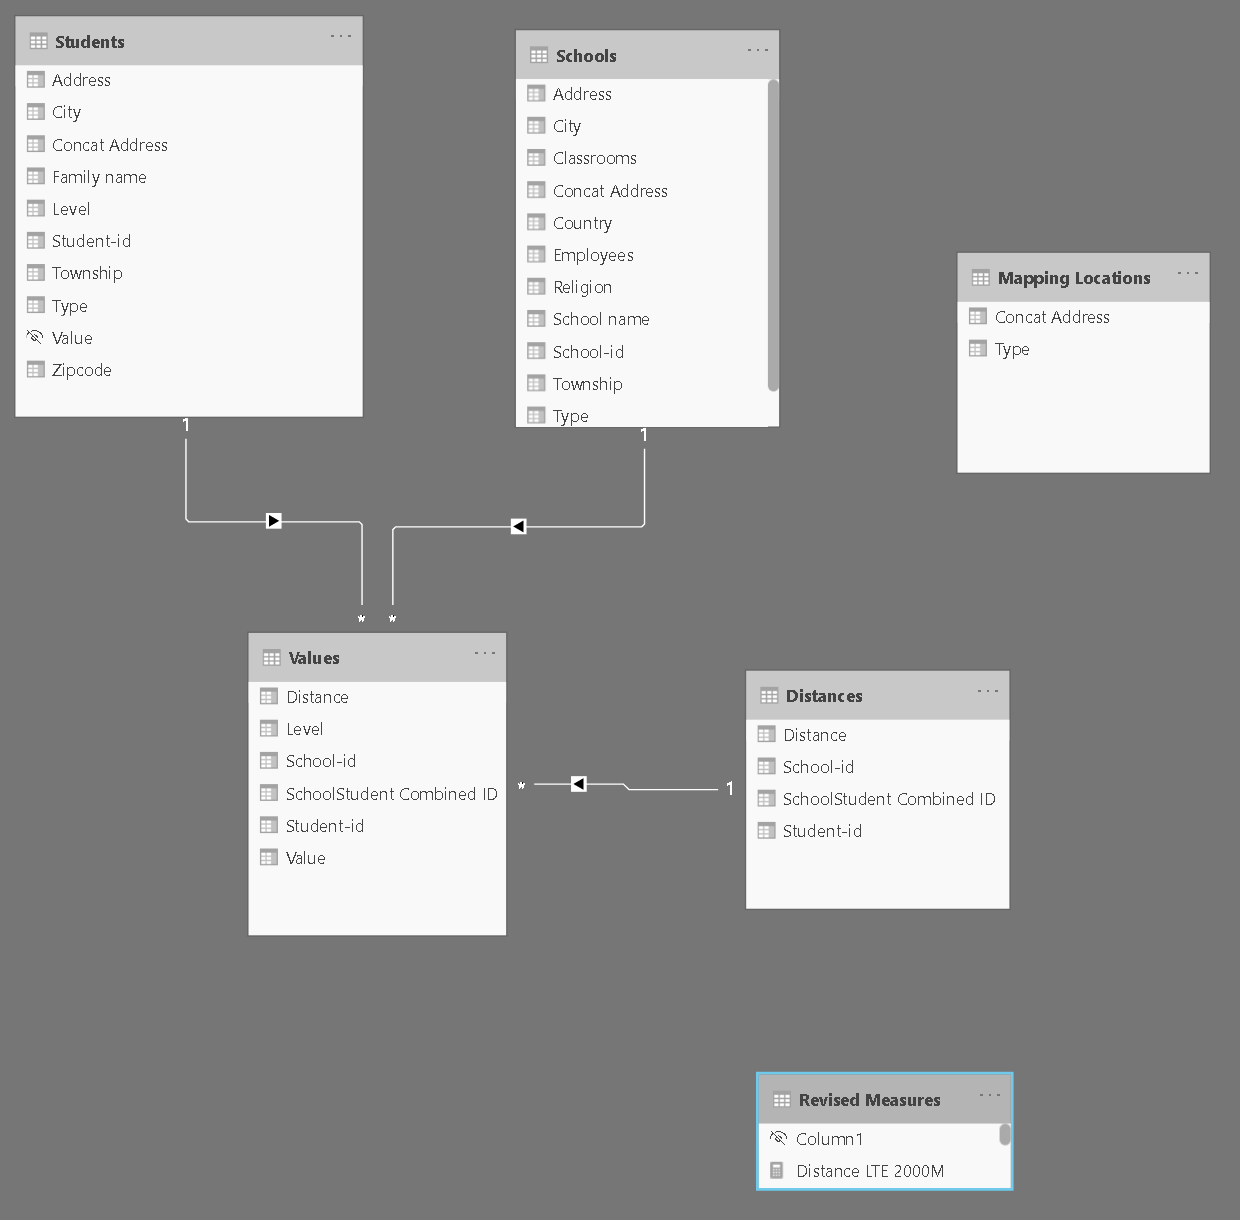
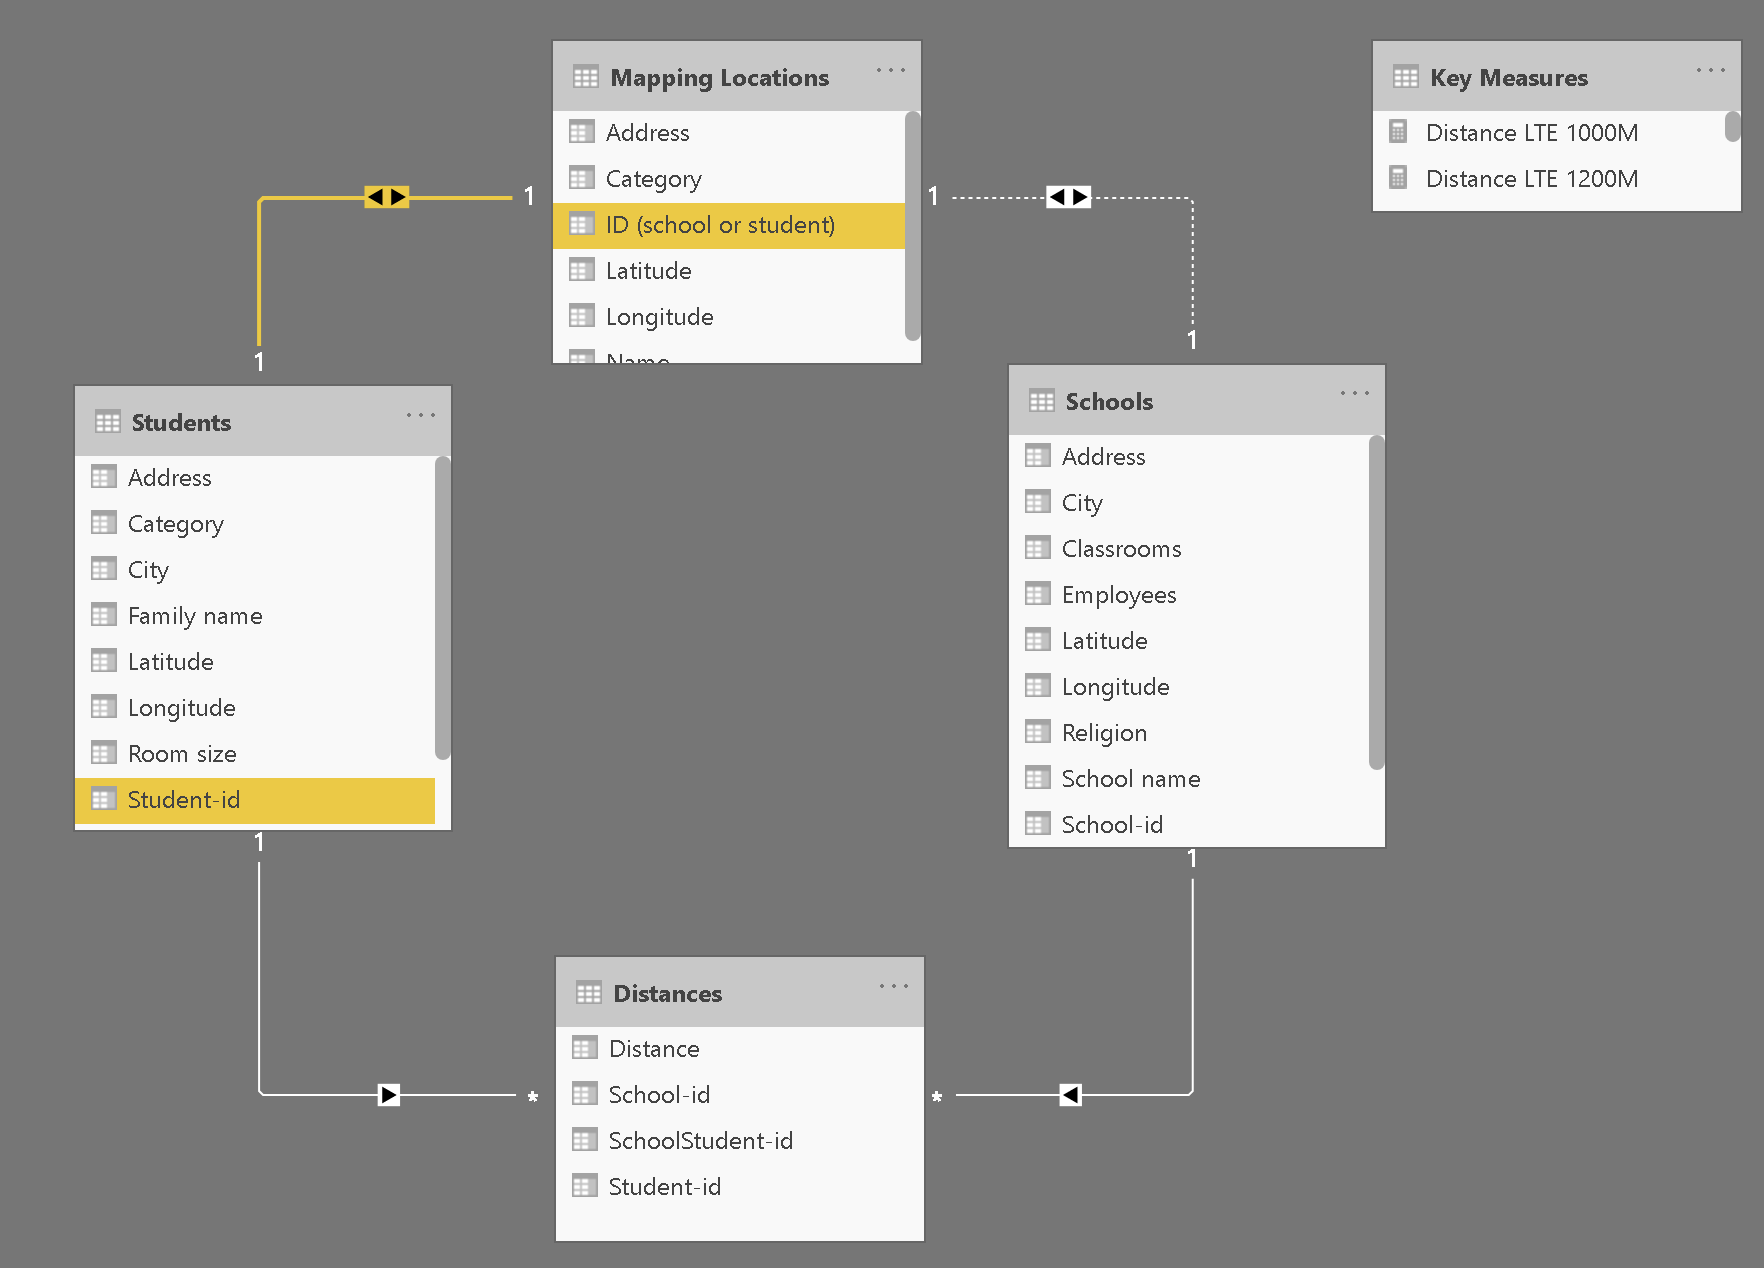
The original data model that you commented on:
The one we’re looking at right now (and also attached in this reply as pbix and excel file):
In your earlier response you implied a one to many relationship between Schools table and Mapping Locations. But there is no such relationship. Every student has only one single address and each address can only belong to a single student or school. Therefore I can only see a one to one relationship.
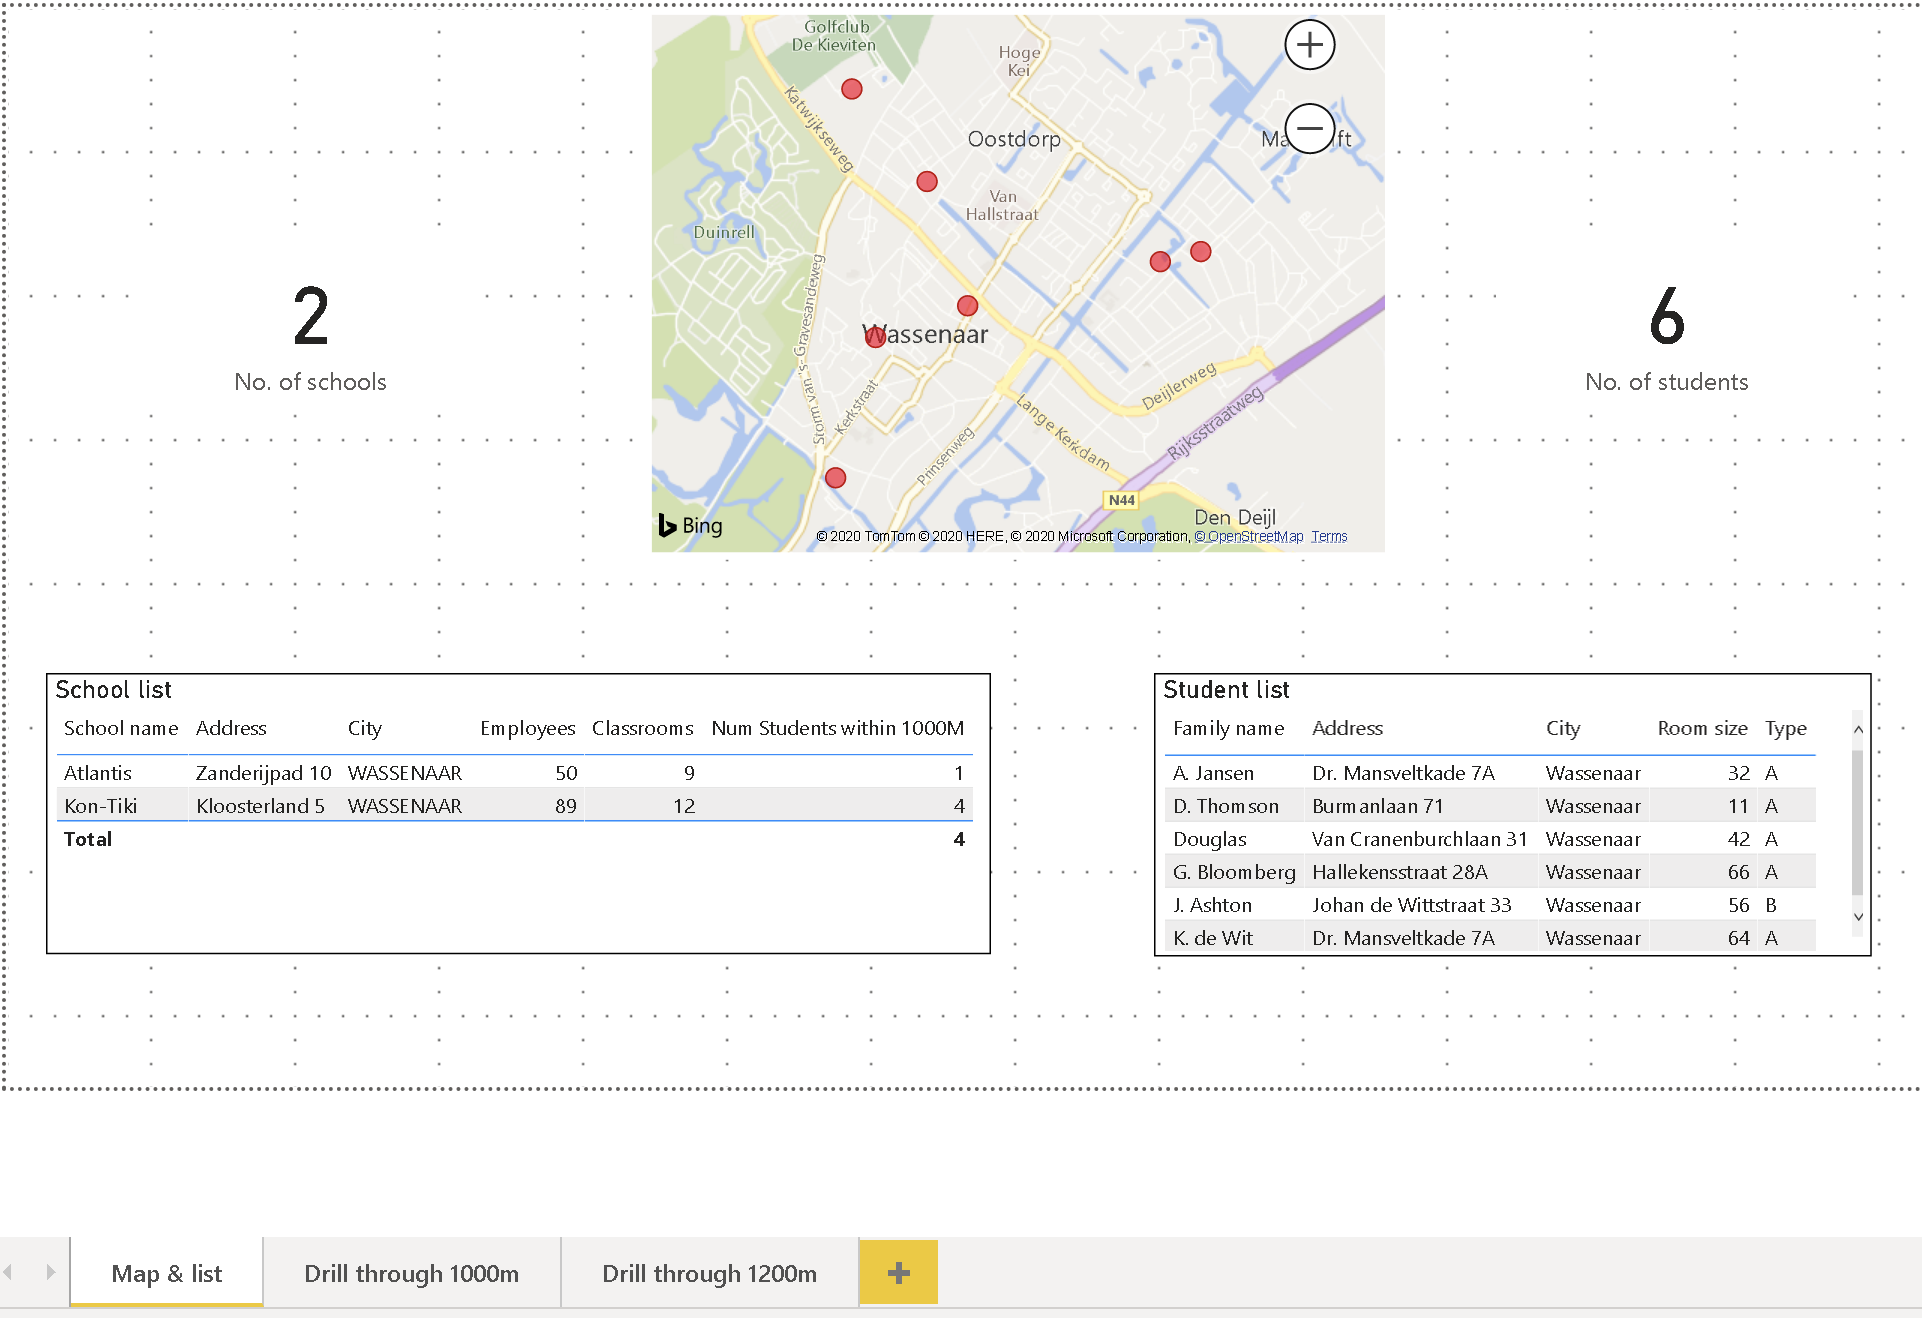
Below you find the pbix including the proposed data model and also the full storyboard in terms of visuals including the drill through pages.
It would be a great help if you can elaborate on this version as it is freed up from any possible misinterpretations. The only question is: how to link the DAX Mapping Locations table with the Students table and the Schools table in such a way that it meets the star scheme requirements and allows proper interaction between the visuals in the first report page.
And with interaction I mean that when I select a single data point in the map visual, the tables below reflect the details of that particular data point. So if it’s a school, a single row for that school will show up in the schools list and the students list will be empty. And if the map visual allows lasso select (like map box) then the selected datapoints of both schools and students will be shown in the tables below the map.
I honestly don’t see how to define those relations properly without returning to the same ambiguity that we started with.
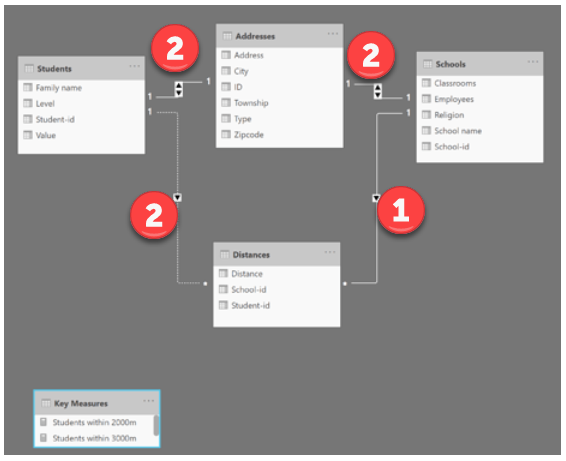
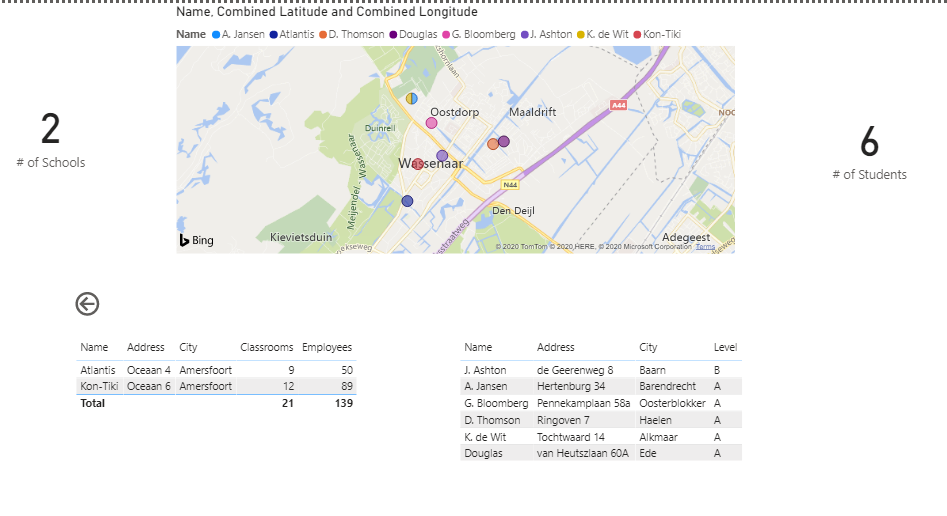
I’m sure there are multiple ways to structure this data model to meet your requirements, but here’s the way I came up with. Maintains star schema, no bidirectional relationships, yet allows visual filtering from the map to the tables, and vice versa, and drillthrough works fine.
To simplify the data model I kept the Distances table disconnected, and where needed (for example the values in the cards) used TREATAS to create the necessary virtual relationships (see example below).