Note: Field in Sample Values are Branched Measures , I am primarily looking for measure. If Measure not possible then Calculated Column I can also try.
I’ll take a look and see what I can come up with. Coincidentally, I was just reviewing the Debugging and Optimization chapter of the Greg Deckler book I mentioned the other day, and he’s got a section on addressing circular dependencies.
Don’t know if a Power Query-based solution might be acceptable, but I’ve been playing around a little with some of the recursive concepts from this video:
If the aggregation and report level is weekly, look into Power Query Group by with the optional parameter GroupKind.Local. An example can be found in this post by Chris Webb.
Hi @BrianJ and @Melissa - Thanks Both for your inputs. I will look into the blogs. As mentioned, Sample data is basically measures that are branching to lot other measures.
So, I am primarily looking for measures but if no option then I will try POC for PQ or CC.
I think I figured out how to break the recursive loop here and still get to the correct results.
Calculate cumulative totals for all four metrics
Closing Inventory Balance = Cumul Opening Balance + Cumul Total Supply - Cumul Total Demand (no recursion, and all calculated on same row)
For Opening Inventory Balance, you will need to write measures to retrieve the previous week’s Closing Inventory Balance and prev week’s InQualityInsp, but I’m sure that won’t be a problem for you.
I actually worked this out in Excel (heresy!, I know…) and have attached my working file.
Really interesting problem. I hope this is helpful to you.
Thanks @BrianJ for the efforts and inputs. Atleast now I have something to work with rather than being completely blank I will work on the suggestions and will come back with the updates.
Very glad to help – I’m thrilled to hear this worked well for you. I can definitely see why this one gave you problems. I tried a bunch of different approaches and algebraic substitutions before getting to this one, and just had to mull it over for a couple of days.
Really unique problem that I haven’t seen before – enjoyed working with you on this one.
Requesting you, please guide me as well on how I can achieve the logic in Power BI
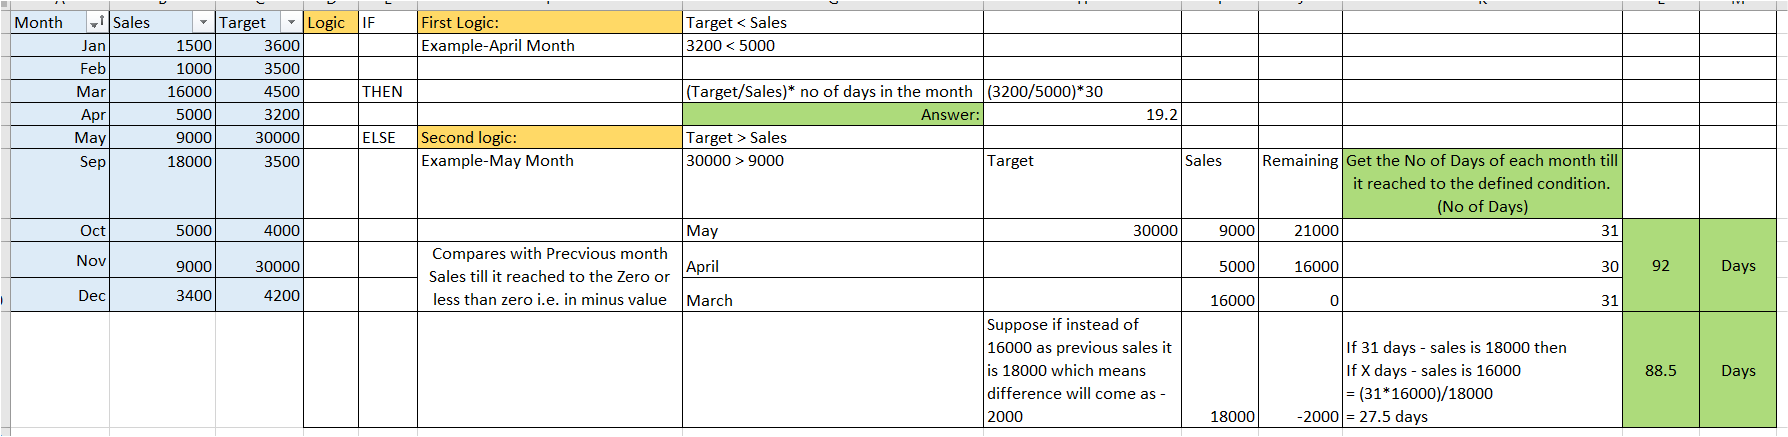
I have sales data where there are three columns.
1st column is Month, which has the data type as a date.
2nd column is Sales, which is nothing, but Sales happened.
3rd column is Target, which is nothing, but Target decided.
PFA Excel
I have written the logic in the attached Excel for which I am looking for the solution. And also pasted the screenshot of it here
Welcome to the community and one golden rule to get your answerer quickly.
–Try to find you question question on form it may be different form your but you can pick up the logic.
–If still you are not able to find the solution create a new thread do not comment on already closed thread so other will help you .
So i request you open a new thread and post you question their.


 I will work on the suggestions and will come back with the updates.