Problem of the Week #9 (PQ) - Oscar Winners

OK, here we go!

Problem of the Week #9 is now live! The YouTube video introducing this week’s problem can be found here.

image

For background on this initiative, check out this post .

Background

I feel like I’ve got big shoes to fill after a great Problem #8 from @alexbadiu and some incredibly elegant and creative solutions (particular shout outs to @Matthias and @Melissa).

A couple of curveballs right off the bat. First, this would typically be the week for a DAX problem, and in the expert rotation it would be led by @haroonali1000. However, due to scheduling issues, he and I have swapped for the month, so you will get the DAX challenge with Haroon in a couple weeks.

Second, while almost all of our problems are drawn from real-world business examples, this one is a combination of my love of: movies (in particular the Academy Awards); the way Power Query can simplify otherwise complex problems; and the Queryon Timeline custom visual. However, I think as you start working on this you will quickly see direct business applications for the techniques it requires.

The Model

To start with, you are given two tables: @Melissa’s awesome Extended Date Table and a second table called Actresses, that you are NOT to use in solving the primary problem – that table is intended only to provide information that you will use for the visualization portion of this problem. In addition, you will be given a large CSV file, that will form the basis of your fact table.

Your Task

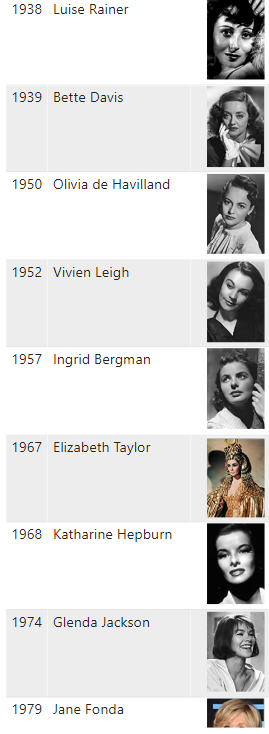
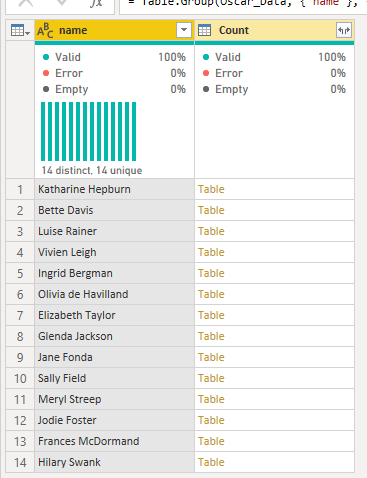
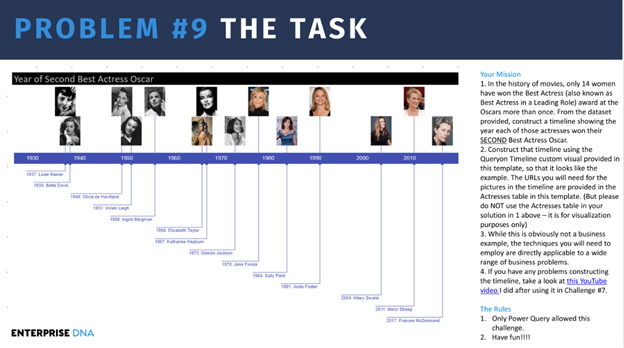
The task for this challenge is to take the CSV data provided (a dataset from Kaggle.com, listing every Oscar-winner in the history of the Academy Awards). Your focus for this analysis will be the Best Actress award (also known as Best Actress in a Leading Role – an important tidbit to keep in mind, hint, hint…). In the history of the Oscars, 14 women have one more than one Best Actress award.

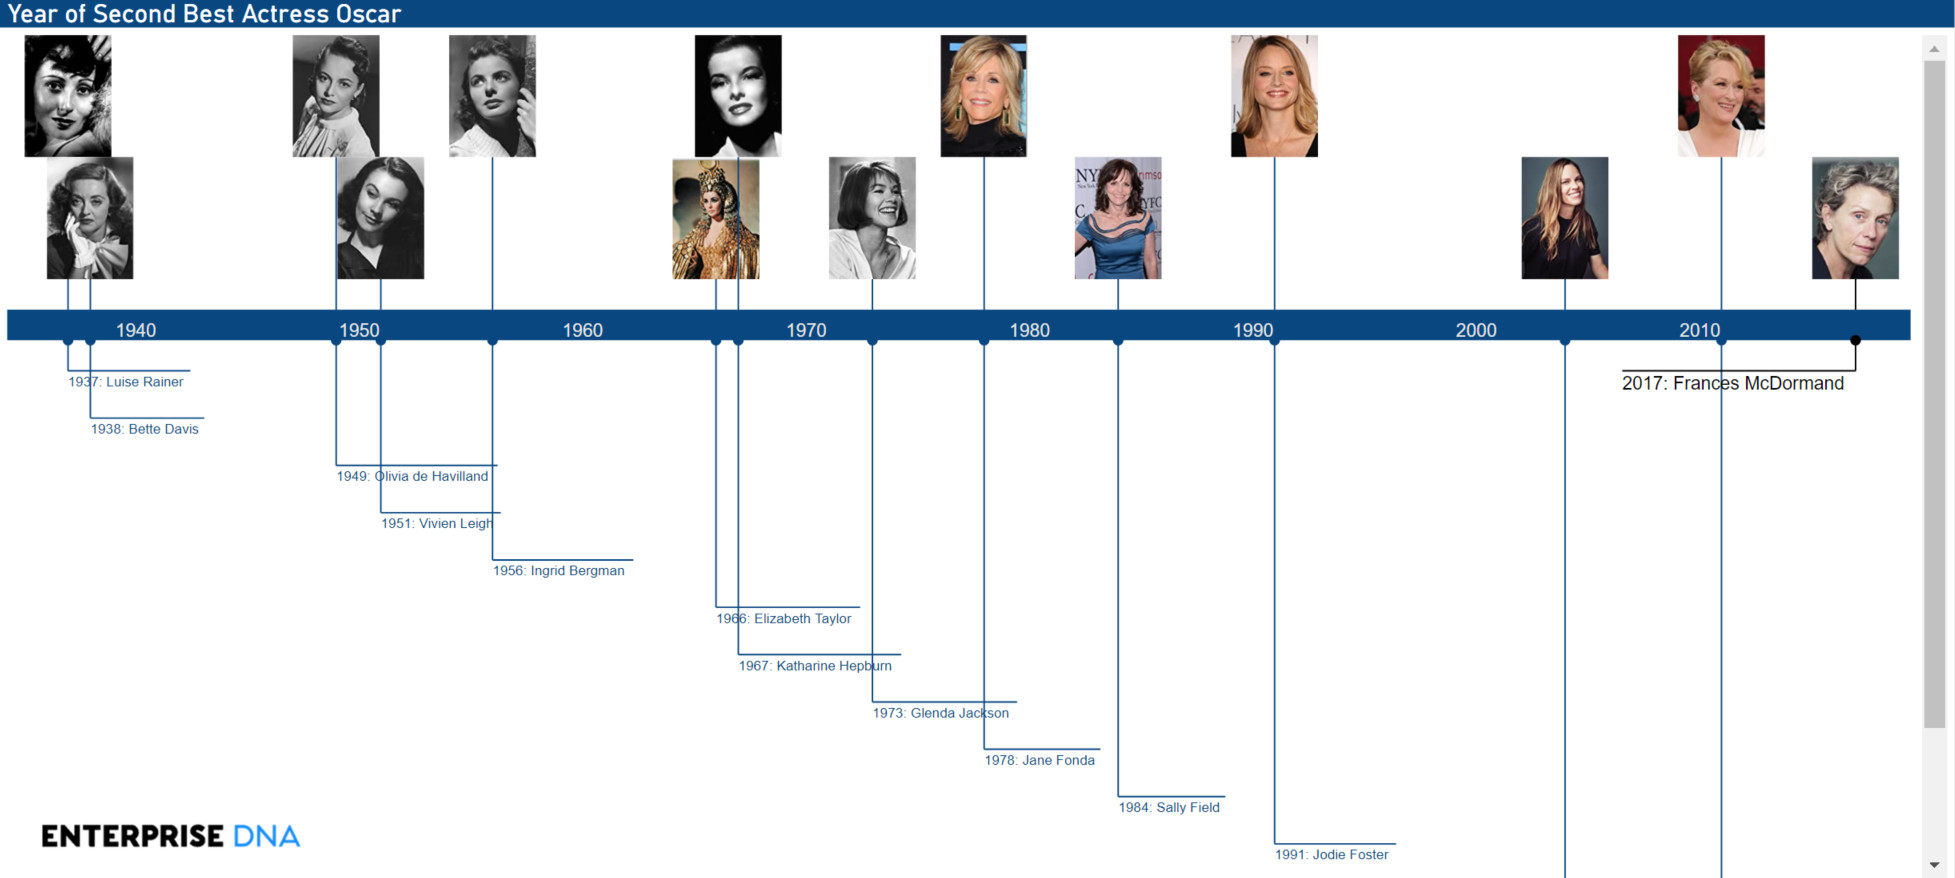
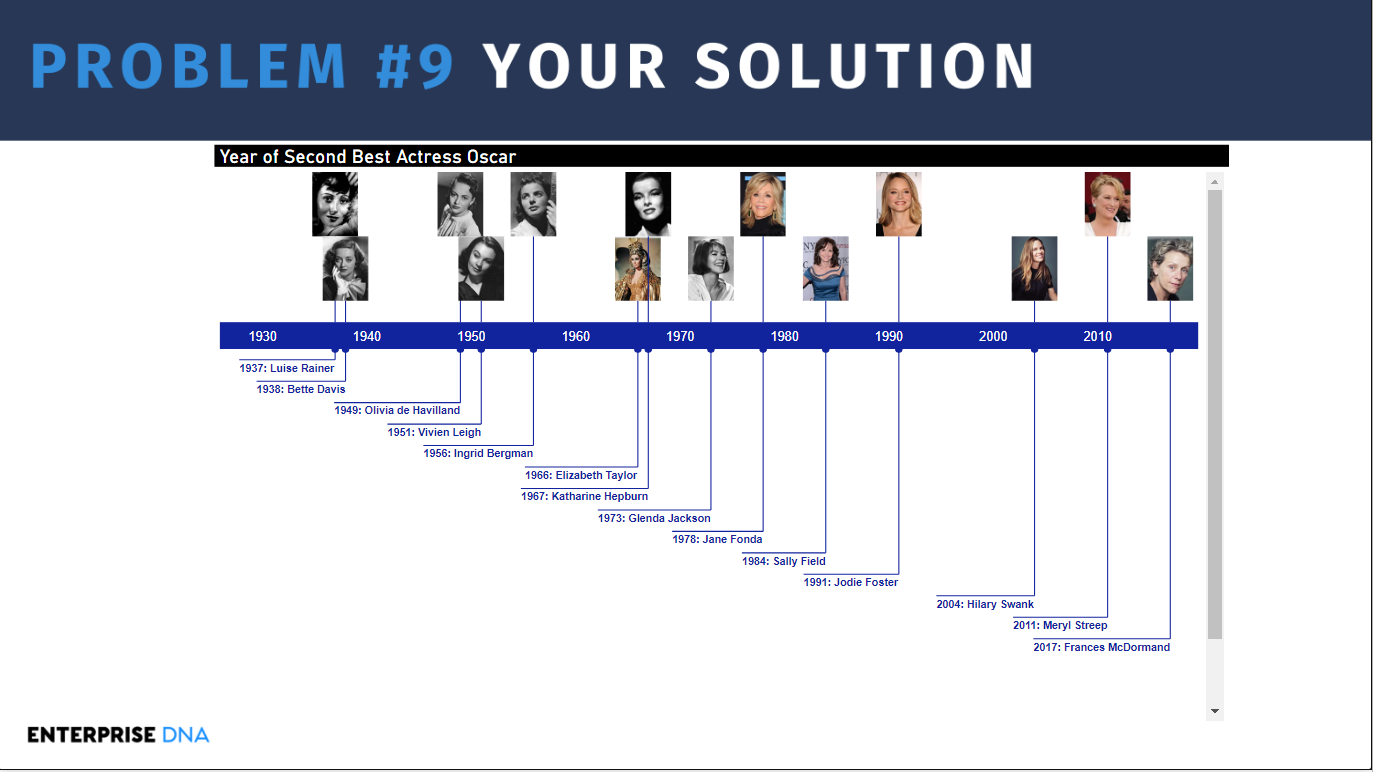
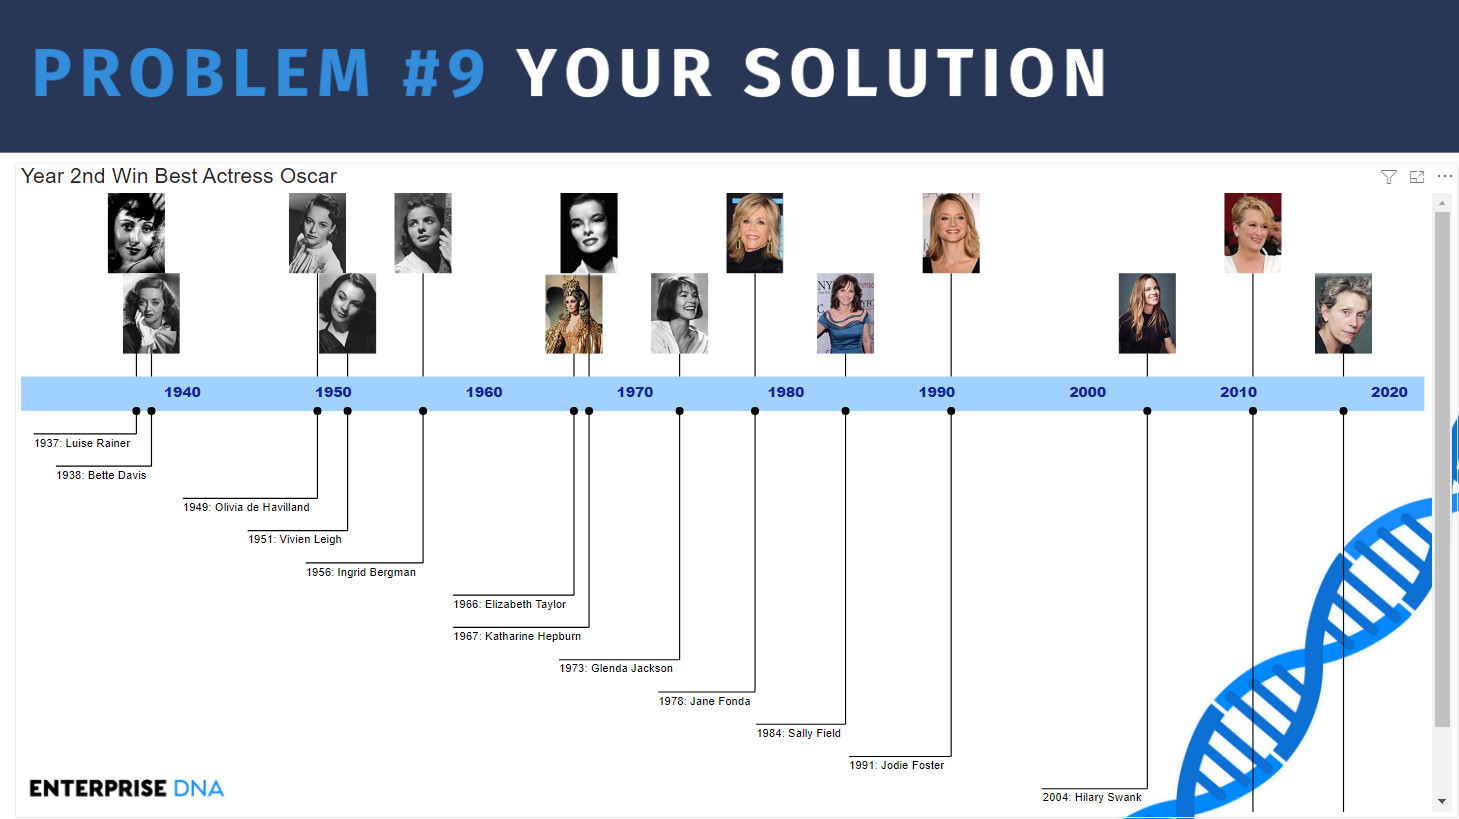
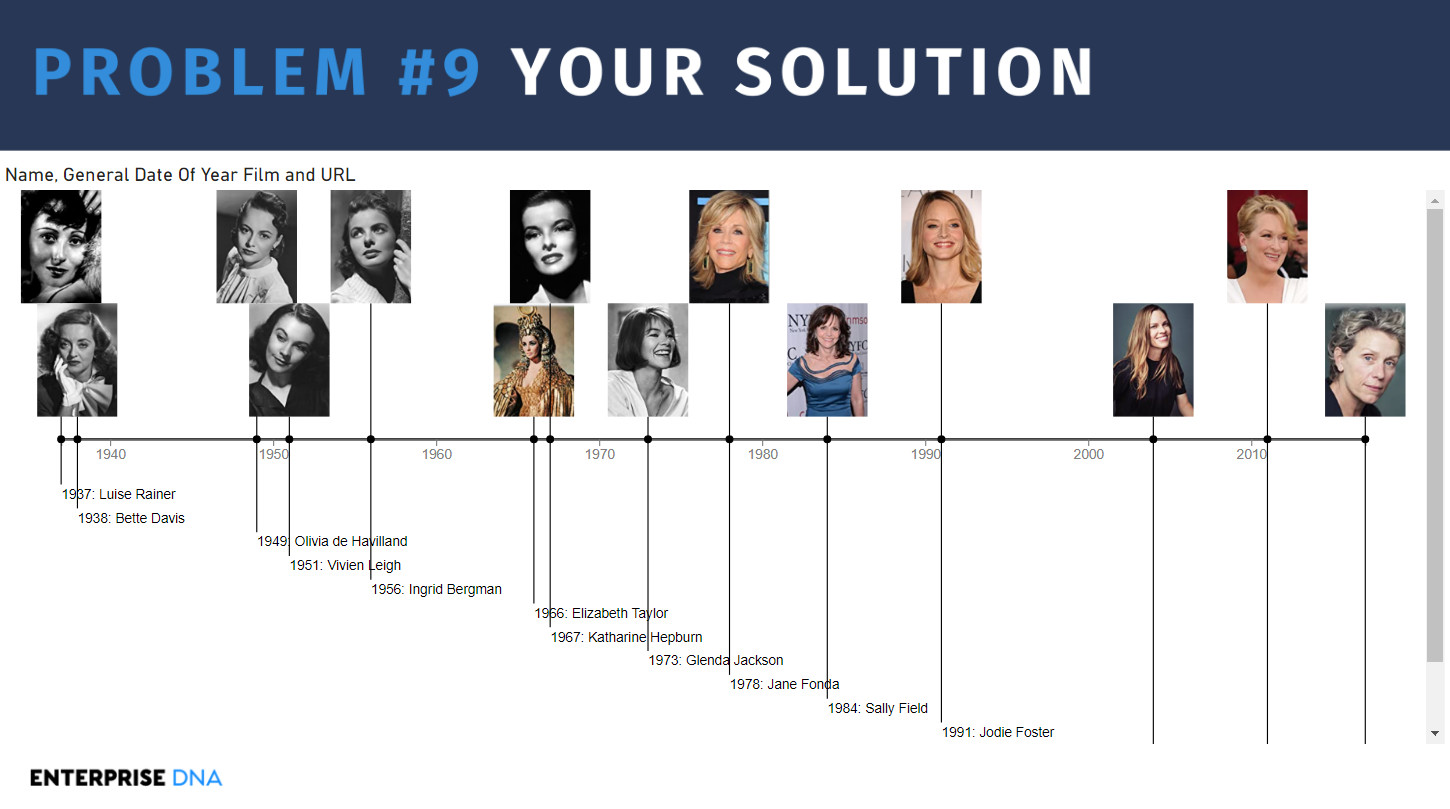
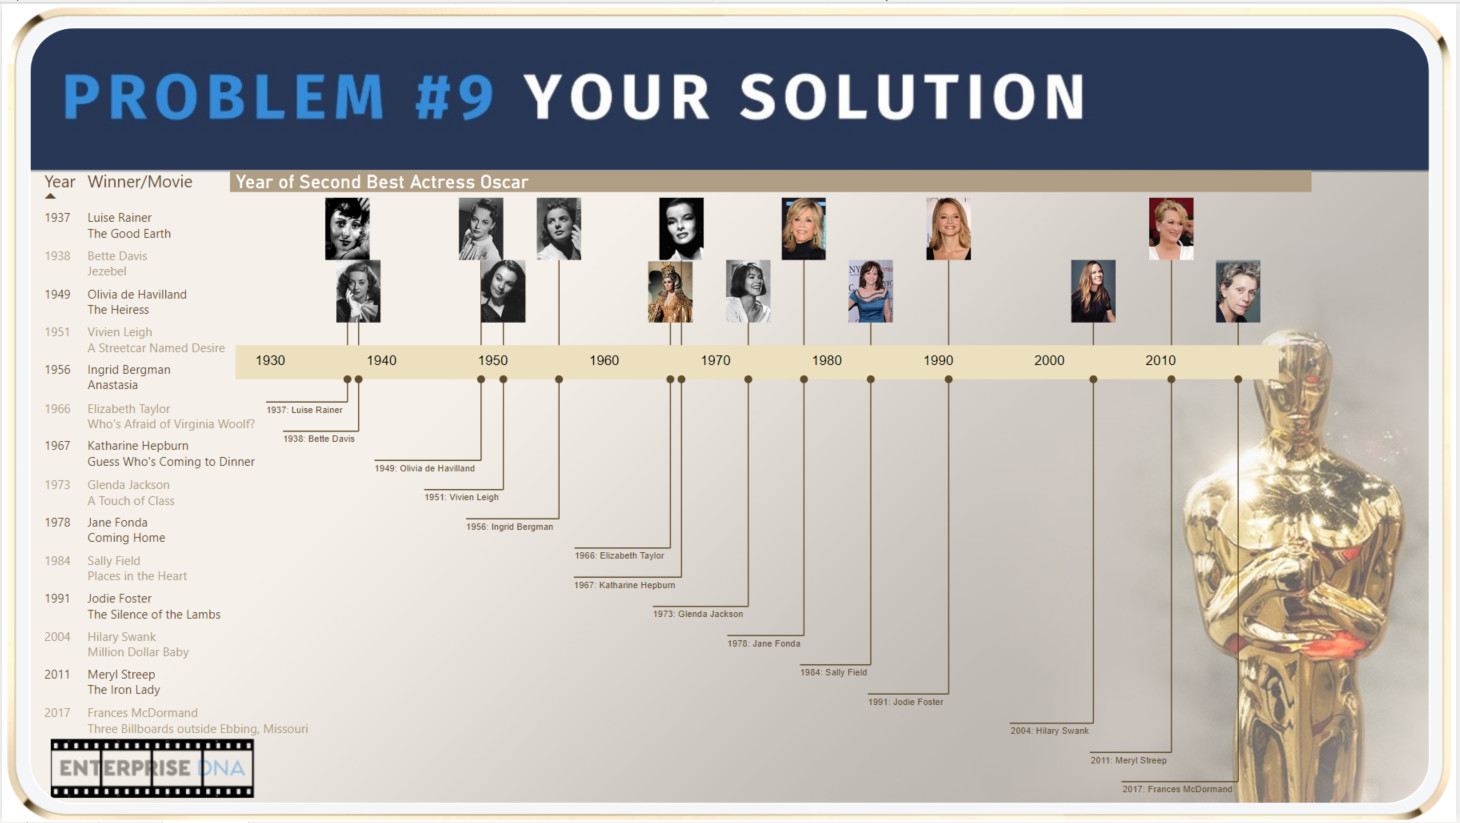
You are tasked with identifying these 14 women in the dataset and the year that each of them won their second Best Actress Oscar . You are to then take this information and visualize the results in a horizontal timeline, using the Queryon Timeline custom visual provided in the attached PBIX file.

How to Approach This Problem

Given that this is a Power Query only challenge, the two categories of tools available to you are the Power Query UI and the M language. The challenge can be successfully completed using only the UI. However, I think the most direct routes to a solution will involve both the UI and a small amount of custom M.

Can You Crack This?

image

In terms of resources available to help you, I did a short intro video to this problem on YouTube. Also, following Data Challenge #7, where I first used the Queryon Timeline, I did a detailed YouTube video on it, accompanied by an equally detailed blog entry.

Posting Your Solution

We ask that if you post anything directly related to a solution to please use the “Hide Details” or “Blur Spoiler” options within your post. This will prevent people who have not yet completed their solution from seeing things they might not want to see yet and could influence their solution.

To use these options, just select the text or image you want to hide, click on the gear icon on the top right at the top of your post and select either Hide Details or Blur Spoiler.

image

Note that this is a Power Query only challenge, so no DAX even if that is what you would choose to use outside of this challenge.

EDNA Problem Solver Stickers

Everyone who successfully completes a Problem of the Week will receive one of these cool Enterprise DNA vinyl laptop stickers:

image

To receive your sticker, when you submit your solution, just send a copy of your physical mailing address to problemoftheweek@enterprisedna.co. (Note: my apologies – I have been so busy working with Sam, the other experts and the EDNA team rolling out new courses, YouTube content and community events and initiatives that I’ve fallen behind on the sticker mailing. If I owe you a sticker, I will get it to you – sorry for the delay).

Deadline and Eligibility

If you want to submit your entry before the solution becomes public, please do so before 10am ET Wednesday April 14, 2021 . Reminder that Problem of the Week is open to everyone – members and non-members. Members should just post your solution directly to this thread in the forum. Non-members can send your solution to me at the email address above or at brian.julius@enterprisedna.co and I will post it to the forum thread for you.

We hope you find this initiative fun, challenging and helpful in continuing to build your Power BI skills. All of the information you will need is contained in the files within this post. If you have any questions or comments, just message me at @BrianJ in this forum thread or at the email address above.

Good luck, and enjoy!!!

  • Brian

P.S. Your feedback is always welcome, and if you have a real-world problem that you think might make a good future Problem of the Week, please email it to us at problemoftheweek@enterprisedna.co. Thanks!

P.P.S. Shout out and huge thanks to the awesome team at Queryon. Right before I finalized this problem, Microsoft changed the requirements for certification for custom visuals, and this change broke the URL image linking feature in custom visuals using external image links, including Queryon Timeline. To solve this problem, the Queryon team compiled and sent me a special version of the program that re-enables this image linking feature. I’ve embedded that version in the PBIX file attached.

Here are the files you will need:

the_oscar_award.csv (892.0 KB)
Problem of the Week #9 - Oscar Winners.pbix (4.7 MB)

7 Likes

@BrianJ - looks like a great challenge. One thing that is great about these Problem of the Weeks is how you all introduce different techniques/tools. I’m looking forward to diving into this one.

Thanks,

Tim

3 Likes

@BrianJ - these are really big shoes, as I had 3 solutions last time - and I enjoyed them all. :slight_smile:
This one involves a variant of one of my favourite patterns. So that is good again.
And as Tim pointed out, you also introduce new tools. That is indeed interesting.
=> I think you filled them well!

Looks good, nice tool!

Summary

I’ll start off with MY solution and add above Queryon Timeline:


Clearly you need a horizontal timeline for this!

And here is the Power Query code. I heard your hint, but didn’t get it immediately…

let
    Source = Data,
    #"Promoted Headers" = Table.PromoteHeaders(Source, [PromoteAllScalars=true]),
    #"Filtered Rows" = Table.SelectRows(#"Promoted Headers", each ([category] = "ACTRESS" or [category] = "ACTRESS IN A LEADING ROLE") and ([winner] = "True")),
    #"Removed Other Columns" = Table.SelectColumns(#"Filtered Rows",{"year_ceremony", "name"}),
    #"Kept Duplicates" = let columnNames = {"name"}, addCount = Table.Group(#"Removed Other Columns", columnNames, {{"Count", Table.RowCount, type number}}), selectDuplicates = Table.SelectRows(addCount, each [Count] > 1), removeCount = Table.RemoveColumns(selectDuplicates, "Count") in Table.Join(#"Removed Other Columns", columnNames, removeCount, columnNames, JoinKind.Inner),
    #"Sorted Rows" = Table.Sort(#"Kept Duplicates",{{"year_ceremony", Order.Ascending}}),
    #"Grouped Rows" = Table.Group(#"Sorted Rows", {"name"}, {{"Data", each _, type table [year_ceremony=nullable text, name=nullable text]}}),
    #"Added Custom" = Table.AddColumn(#"Grouped Rows", "2nd Oscar", each Table.SelectColumns([Data], "year_ceremony"){1}),
    #"Expanded 2nd Oscar" = Table.ExpandRecordColumn(#"Added Custom", "2nd Oscar", {"year_ceremony"}, {"2nd Oscar"})[[name],[2nd Oscar]],
    #"Changed Type" = Table.TransformColumnTypes(#"Expanded 2nd Oscar",{{"2nd Oscar", type date}})
in
    #"Changed Type"
2 Likes

Very fun challenge!

Problem of the Week #9 - Oscar Winners A.Badiu.pbix (4.7 MB)

Spoiler alert

I used Group By and then with the use of Table Index I filtered the rows needed. I took more time discovering and building the visualization. Thank you for organizing this challenge! It was lots of fun!

    #"Promoted Headers" = Table.PromoteHeaders(Source, [PromoteAllScalars=true]),
    #"Filtered Rows" = Table.SelectRows(#"Promoted Headers", each ([winner] = "True") and ([category] = "ACTRESS" or [category] = "ACTRESS IN A LEADING ROLE")),
    #"Grouped Rows" = Table.Group(#"Filtered Rows", {"name"}, {{"Data", each _, type table [year_film=nullable text, year_ceremony=nullable text, ceremony=nullable text, category=nullable text, name=nullable text, film=nullable text, winner=nullable text]}}),
    #"Added Custom" = Table.AddColumn(#"Grouped Rows", "Index", each Table.AddIndexColumn([Data], "Index", 0,1)),
    #"Removed Other Columns" = Table.SelectColumns(#"Added Custom",{"Index"}),
    #"Expanded Index" = Table.ExpandTableColumn(#"Removed Other Columns", "Index", {"year_film", "year_ceremony", "ceremony", "category", "name", "film", "winner", "Index"}, {"year_film", "year_ceremony", "ceremony", "category", "name", "film", "winner", "Index.1"}),
    #"Filtered Rows1" = Table.SelectRows(#"Expanded Index", each ([Index.1] = 1)),
    #"Changed Type" = Table.TransformColumnTypes(#"Filtered Rows1",{{"year_film", type date}, {"year_ceremony", type date}, {"ceremony", Int64.Type}, {"category", type text}, {"name", type text}, {"film", type text}, {"winner", type text}, {"Index.1", Int64.Type}})
in
    #"Changed Type"
1 Like

@BrianJ

Here is my solution

Summary

Problem of the Week #9 - Rajesh.pbix (4.8 MB)

1 Like

@tweinzapfel,

Thanks very much for the feedback – I agree 100%. When we first started Problem of the Week, one of the goals we had was to really take advantage of the diversity of thought and experience of the expert team, both in formulating problems and discussing how to solve them. Each of us have some different thoughts about particular tools that should be in your Power BI toolbox, so the rotating leadership provides the opportunity for a lot of different techniques, approaches, ideas, etc. to get showcased.

I’m also a huge believer in the power of small improvements aggregated over long periods. No one problem may feel like a monumental increase in capabilities (though for me Problem #4 HAS had a massive impact on how I handle planned versus actual budget scenarios), but participating regularly for say, six months or a year likely will have a major impact on overall skill level.

  • Brian

For the folks making quick work of this problem, if you’re looking for a way to further challenge yourselves, try completing the problem using only the UI. There’s definitely a way to do it, but I found that to be a much tougher nut to crack than using a small amount of M code.

Thanks for participating!

  • Brian

Hi @BrianJ,

Thanks for hosting this round!

:thinking: I think the solution revolves around a technique that is vital to have in your toolkit. And that’s always good news. Had fun working through it.
.

Expand to read about my solution.

I thought I would take advantage of the fact that a List is an ordered sequence of values. And use the positional index operator that’s the zero-based position inside { }, to access that item.

let
    Source = Table.PromoteHeaders( Csv.Document( File.Contents( FileLocation ), [Delimiter=",", Columns=7, Encoding=1252, QuoteStyle=QuoteStyle.None]), [PromoteAllScalars=true]),
    FilterRows = Table.SelectRows( Source, each ([category] = "ACTRESS" or [category] = "ACTRESS IN A LEADING ROLE") and ([winner] = "True") ),
    GroupRows = Table.Group( FilterRows, {"name"}, {{"AllRows", each _, type table [year_film=nullable text, year_ceremony=nullable text, ceremony=nullable text, category=nullable text, name=nullable text, film=nullable text, winner=nullable text]}}),
    GetYear = Table.RemoveColumns( Table.SelectRows( Table.AddColumn( GroupRows, "2nd Win", each if Table.RowCount([AllRows]) >=2 then #date( Number.From([AllRows]{1}[year_film]?), 1, 1 ) else null, type date ), each [2nd Win] <> null ), "AllRows" )
in
    GetYear 

Never used this time line visual before, so that was a nice addition.
All put together.

Here’s my solution file. POTW #9 - Solution Melissa.pbix (5.0 MB)

If you liked the technique I’ve used in this solution, you might also like this video.

https://www.youtube.com/watch?v=zUCBYDvRUYM

1 Like

Brian I thought it was impossible without writing some logic. But then I clicked my way around. Thanks for the idea!

Summary
let
    Source = Data,
    #"Promoted Headers" = Table.PromoteHeaders(Source, [PromoteAllScalars=true]),
    #"Filtered Rows" = Table.SelectRows(#"Promoted Headers", each ([category] = "ACTRESS" or [category] = "ACTRESS IN A LEADING ROLE") and ([winner] = "True")),
    #"Removed Other Columns" = Table.SelectColumns(#"Filtered Rows",{"year_ceremony", "name"}),
    #"Kept Duplicates" = let columnNames = {"name"}, addCount = Table.Group(#"Removed Other Columns", columnNames, {{"Count", Table.RowCount, type number}}), selectDuplicates = Table.SelectRows(addCount, each [Count] > 1), removeCount = Table.RemoveColumns(selectDuplicates, "Count") in Table.Join(#"Removed Other Columns", columnNames, removeCount, columnNames, JoinKind.Inner),
    #"Grouped Rows" = Table.Group(#"Kept Duplicates", {"name"}, {{"Min", each List.Min([year_ceremony]), type nullable text}, {"Data", each _, type table [year_ceremony=nullable text, name=nullable text]}}),
    #"Expanded Data" = Table.ExpandTableColumn(#"Grouped Rows", "Data", {"year_ceremony"}, {"year_ceremony"}),
    #"Changed Type" = Table.TransformColumnTypes(#"Expanded Data",{{"year_ceremony", Int64.Type}, {"Min", Int64.Type}}),
    #"Inserted Subtraction" = Table.AddColumn(#"Changed Type", "Subtraction", each [Min] - [year_ceremony], Int64.Type),
    #"Filtered Rows1" = Table.SelectRows(#"Inserted Subtraction", each ([Subtraction] <> 0)),
    #"Removed Duplicates" = Table.Distinct(#"Filtered Rows1", {"name"}),
    #"Removed Other Columns1" = Table.SelectColumns(#"Removed Duplicates",{"name", "year_ceremony"})
in
    #"Removed Other Columns1"
2 Likes

@Matthias,

Yup – nicely done!

  • Brian

Hello @BrianJ,

Thank You for hosting this challenge. Really loved working on it.

Here’s the solution.

Summary

To be honest, initially I was stuck onto the result as 13 and realised that “Jane Fonda” had received an Oscar under two categories i.e. “Actress” and “Actress In A Leading Role”. Than again started with the “Grouping” process and this time got the results as 17. And started to scratch my head about how to get the results as 14 now. But ultimately was able to achieve the result as 14 (finally). :joy:

And also learned something new about this visualization and really loved to explore every feature of it.

Thanks and Warm Regards,
Harsh

1 Like

@BrianJ,

Given my lack of experience in M code, this one was a definitely a great learning experience. I know that no DAX is allowed for the solution. However, I did add a slicer to where one can toggle between seeing the visual for the 1st, 2nd, 3rd, or even 4th award (but limited to just the 14 actresses). So I did cheat and threw in a measure to change the title based on the filter.

Here was my approach:

Summary

Problem of the Week #9 - Oscar Winners (tweinzapfel).pbix (4.7 MB)

First – I created a function in Power Query to add an index column to rank rows by grouping in a column. This code was courtesy of Chris Webb.
(//Source: https://blog.crossjoin.co.uk/2015/05/11/nested-calculations-in-power-query/)

Next steps:

  1. Filtered to just Actress or Actress in a Leading Role and Winner = “True”

  2. Added a custom column to count the number of times the same actress appeared in the dataset. (Note – M code obtained via searching on the web; )

  3. I then filtered to only those actresses who had won 2 or more awards

  4. I then used the Group By function to group the data by actress.
    Pic1

  5. I then added a Custom Column that removed all the columns except the name of the actress and the year that the film was made (Note – I could have left this information for other visuals, but removed them for purposes of this exercise)

  6. I added another Custom Column that applied the custom ranking function (referenced above) to each table done in Step 5. This added the individual ranking of awards for each actress (i.e. 1st award was the earliest date, etc.)

  7. With the new column added in step 6, I then expanded every table in that new custom column. All the other columns were then removed so that I was left with a table of just actress names, the year of the film, and the number of the award.

  8. Lastly – I merged this table with the Actresses table in order to add in the URL for the image.

Additional credit is provided to Brian Grant for an excellent video on transforming nested tables as this was completely new to me and was ultimately the key for my approach:
https://www.csgpro.com/blog/transforming-nested-tables-in-power-query/

3 Likes

@tweinzapfel,

Your post absolutely made my day. If someone were to have asked me what I hoped to achieve in developing this particular problem, your post would be a perfect summary. Basically, putting people who may not have experience or comfort with M code in a position where they needed to do what @Melissa refers to as “learn by Googling”. Searching on individual functions is a terrible way to learn DAX, but a pretty awesome way to learn M (with approximately 800 separate M functions, it’s actually the only way to some extent), and with some creative googling and experimentation you can use this approach to solve a wide array of Power Query problems.

Thanks very much for your detailed writeup – it’s a great specific example of the “learn by googling” model, and one I’m sure I’ll be referring future posters to frequently. Well done, sir!

– Brian

2 Likes

Hi @Brian, thanks for the introduction of this Visual Queryon Timeline. This is my solution for this POW#9

Problem of the Week #9 - Oscar Winners - JoseBressanV2.pbix (4.8 MB)

4 Likes

@jbressan,

Wow – gorgeous job on the visualization. What program did you use to add the enhancements to the Queryon visual?

– Brian

1 Like

Hi @BrianJ, I usually use PowerPoint to work on the visual identity of the report. For the colors of this report I selected three golden contrasts with the PowerPoint eyedropper tool on the figure of the Oscar.

The PowerPoint template, I found it with the help of google search.

1 Like

All,

As always, really been enjoying going through your various solutions on this one.

Attached is my solution, including some additional material I’ll be going through in the solution video later this week.

  • Brian
Summary

Problem of the Week #9 - Oscar WInners Solution @BrianJ.pbix (5.2 MB)

Hello,

As this is my “first problem” I hope I did respect the procedures… :slight_smile:
And here is my solution:

let
    Source = Csv.Document(File.Contents("D:\EnterpriseDNA\Problem of the Week #9\the_oscar_award.csv"),[Delimiter=",", Columns=7, Encoding=1252, QuoteStyle=QuoteStyle.None]),
    #"Promoted Headers" = Table.PromoteHeaders(Source, [PromoteAllScalars=true]),
    #"Filtered - Actresses & Winner" = Table.SelectRows(#"Promoted Headers", each ([winner] = "True") and ([category] = "ACTRESS" or [category] = "ACTRESS IN A LEADING ROLE")),
    #"Grouped Rows" = Table.Group(#"Filtered - Actresses & Winner", {"name"}, {{"Count", each Table.RowCount(_), Int64.Type}, {"AllRecords", each _, type table}}),
    #"Filtered - min 2 awards" = Table.SelectRows(#"Grouped Rows", each ([Count] <> 1)),
    #"Invoked - fnAddRank" = Table.TransformColumns(#"Filtered - min 2 awards", {"AllRecords", each fnAddRank(_)}),
    #"Expanded AllRecords" = Table.ExpandTableColumn(#"Invoked - fnAddRank", "AllRecords", {"year_ceremony", "Index"}, {"AllRecords.year_ceremony", "AllRecords.Index"}),
    #"Filtered - second award" = Table.SelectRows(#"Expanded AllRecords", each ([AllRecords.Index] = 2))
in
    #"Filtered - second award"

And the function fnAddRank

(srcTable as table) as table =>
let
    Source = srcTable,
    #"Sorted Rows" = Table.Sort(Source,{{"year_ceremony", Order.Ascending}}),
    #"Added Index" = Table.AddIndexColumn(#"Sorted Rows", "Index", 1, 1, Int64.Type)
in
    #"Added Index"

Problem of the Week #9 - Oscar Winners - LucianC.pbix (4.6 MB)

2 Likes

@Lucian,

Nicely done! Great to have you aboard - thanks for participating!

  • Brian
1 Like

Here is my solution. I must admit this a new visual to me, but I think I will be using it again.

Steps taken:

  • Imported CSV
  • Promoted headers
  • Filtered only ‘Actress’ and ‘Actress in Leading Role’
  • Grouped by row count and max year
  • Filtered where count >1
  • Added date with a calculated column of 01/01/[year]
  • Change data type to date

let
Source = Csv.Document(File.Contents(“C:\Users\chris\OneDrive - Logical BI\IT\Power BI\Enterprise DNA\Problem of the Week\the_oscar_award.csv”),[Delimiter=",", Columns=7, Encoding=1252, QuoteStyle=QuoteStyle.None]),
#“Promoted Headers” = Table.PromoteHeaders(Source, [PromoteAllScalars=true]),
#“Filtered Actresses” = Table.SelectRows(#“Promoted Headers”, each ([winner] = “True”) and ([category] = “ACTRESS” or [category] = “ACTRESS IN A LEADING ROLE”)),
#“Grouped Rows” = Table.Group(#“Filtered Actresses”, {“name”}, {{“Count”, each Table.RowCount(_), Int64.Type}, {“LastYear”, each List.Max([year_ceremony]), type nullable text}}),
#“Filtered Multiple Winners” = Table.SelectRows(#“Grouped Rows”, each [Count] > 1),
#“Added Date” = Table.AddColumn(#“Filtered Multiple Winners”, “Date”, each “01/01/” & [LastYear]),
#“Changed Date Data Type” = Table.TransformColumnTypes(#“Added Date”,{{“Date”, type date}})
in
#“Changed Date Data Type”

Problem of the Week #9 - Oscar Winners.pbix (4.7 MB)