All,
As always, thanks to all who participated formally by posting solutions, but I also hope there are a lot of you taking a swing at these problems, even if you are not posting. The solution video for this problem is now up on YouTube, and I will also walk through the key points below.
In putting this problem together, I had three primary objectives:
1. Learn/practice with the Group By/All Rows construct - as I’ve talked about at length in this recent video and in a number of forum solutions, this combination is incredibly powerful and allows you to simply solve a wide range of grouping/aggregation-related problems with little or no DAX.
2. Develop some comfort with writing basic M code - I’ve seen a couple of recent videos (definitely not Enterprise DNA videos) arguing that you don’t really need to learn M code at all. To me this is completely wrongheaded . Gil Raviv, one of the foremost experts on Power Query, estimates that approximately 40% of data prep problems can be solved using the PQ UI only, whereas over 80% (!) can be solved with some basic knowledge of creating custom columns using M. This represents a HUGE return on investment – being able to increase your capabilities in a key pillar by over 100% by learning techniques that are probably far less difficult than you might think. Thus, I wanted to use this problem to frame a generalizable approach you can use to start incorporating basic M code into your solutions with pretty minimal training or knowledge in this area.
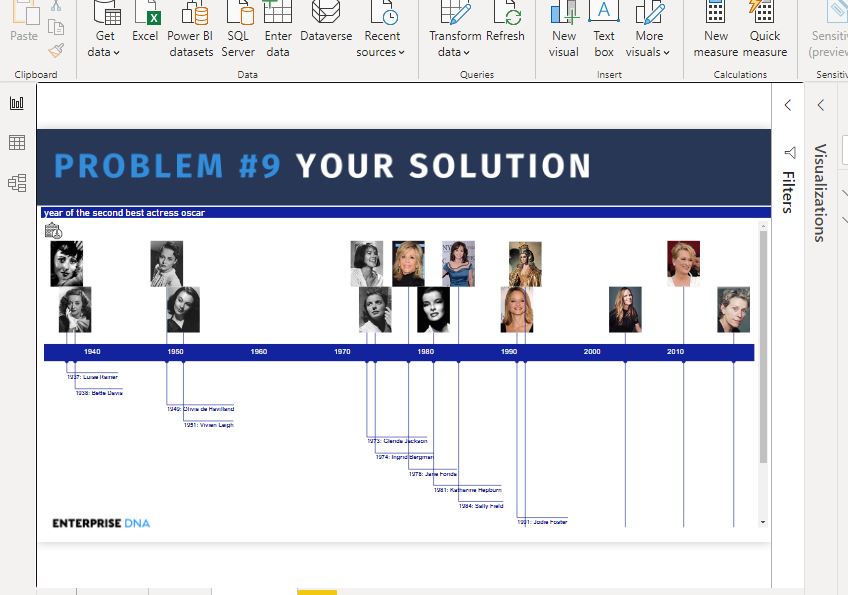
3. Introduce the Queryon Timeline custom visual – I think this is a great visual, that can be used to dramatically present data in a way not possible using Power BI’s native capabilities or even other custom visuals
In tackling a multifaceted problem like this, I often find the best way to start is to take it out of the context of Power BI or even programming entirely. Thus, imagine if instead of providing a CSV file, I had just provided you with 93 separate slips of paper, each with a Best Actress winner and year on it. That then becomes conceptually quite a simple problem to solve. I imagine most people’s solutions would look something like this:
-
Sort slips into groups by actress
-
Throw out any group with just one slip in it
-
For the remaining groups, sort slips in each group by ascending date
-
Choose the second occurring date in each group
Once we have a conceptual solution like this, the rest is just a matter of figuring out how to make Power Query execute each of the steps.
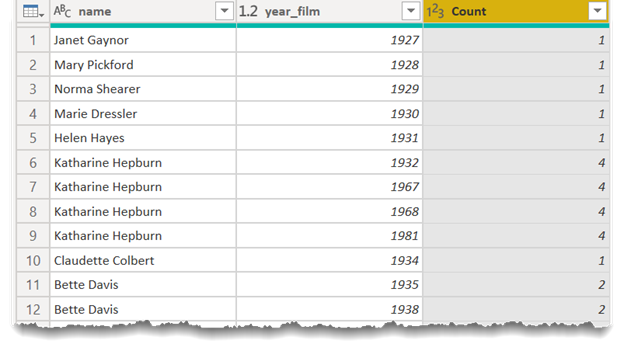
First, use Group By with All Rows to count the number of Best Actress awards per actress:
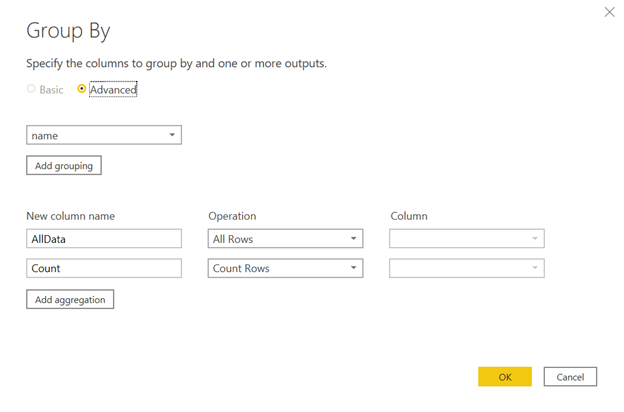
This grouping function returns a table that looks like this:
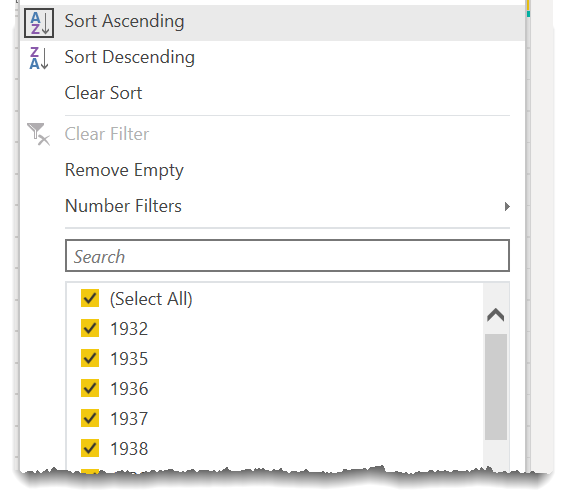
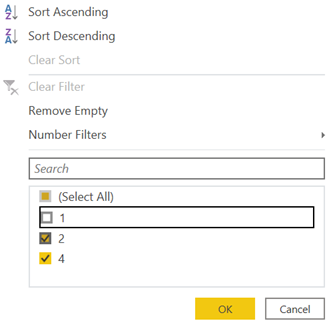
Now, it’s a simple matter to filter on count and remove all awardees with a count of one:
and then sort the results by name and then by year:
this puts us 75% of the way home in implementing our conceptual model. The last step is to regroup by name and develop an index for each group, so that we can pull out the second record in each group as defined by the year. To do so, if we don’t know the M function to do that, we can do what Enterprise DNA Resident Power Query Master @Melissa refers to as “Learn by Googling”. This approach works well for Power Query/M because: a) unlike DAX, the names of most M functions quite literally describe what the function does; and b) also unlike DAX, you can often write a single line of M code in isolation and have it perform a very useful function.
The most challenging task in this is often figuring out what term(s) to search on, but after a while you will begin to learn certain phrases (e.g. “nested table”) that help you better describe what you’re looking for and return the results you want. Three very fruitful sources for this “Learn by Googling ” approach are the Microsoft M Reference Guide, for which I have developed a handy External Tool to bring you there directly from within Power BI, and the Microsoft Community, as well as our own forum here.
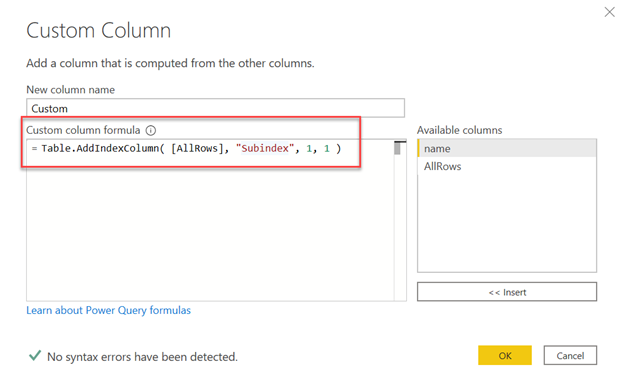
A couple of searches likely will bring you to the Table.AddIndexColumn() function, which you can implement quite easily as a custom column:
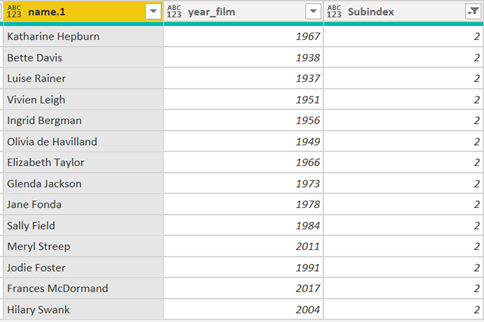
once you have that grouped index created, you can filter it down to 2 only to choose the second win year for each actress, which completes the implementation of our conceptual model and solves the problem (but for a few minor remaining tasks related to the visual):
(Note: If you want to see a great example of someone without any real M experience effectively working through this approach, check out eDNA member @tweinzapfel’s outstanding solution writeup to this problem above.)
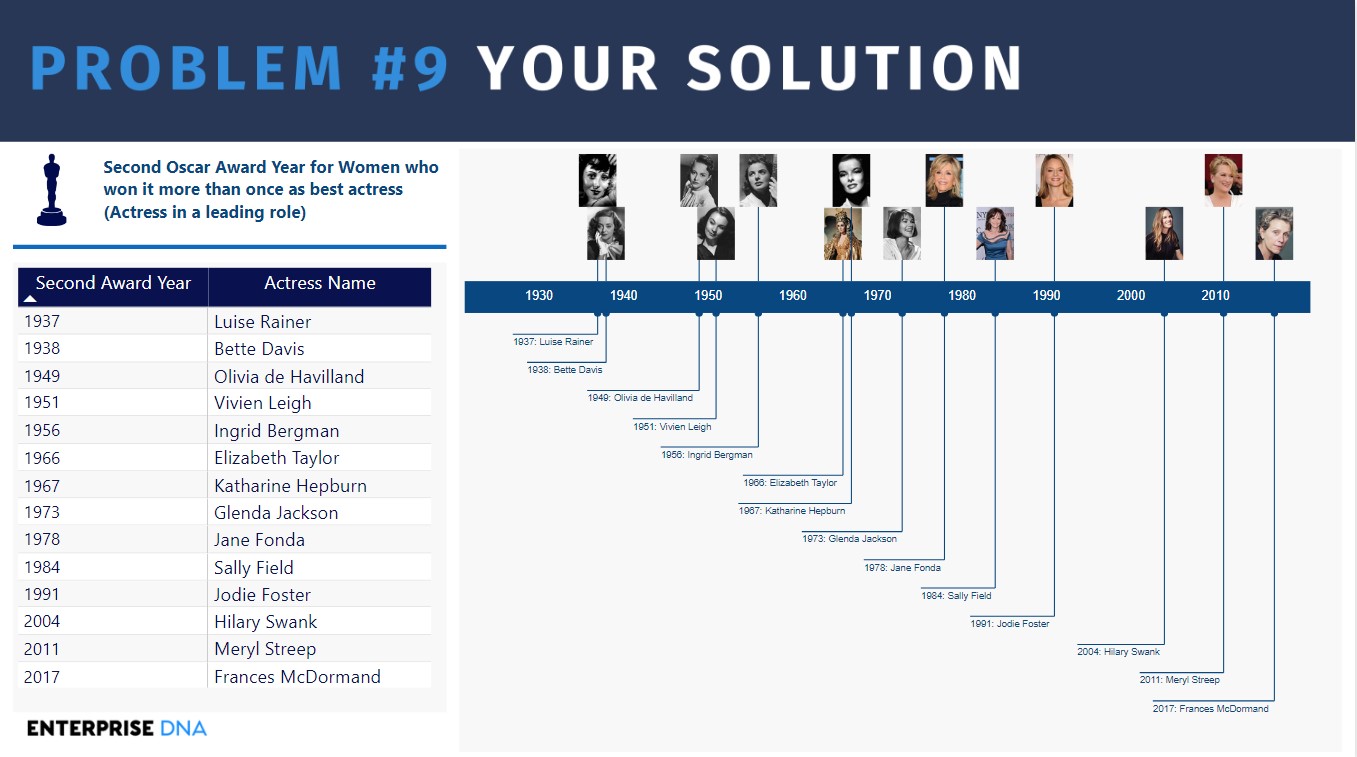
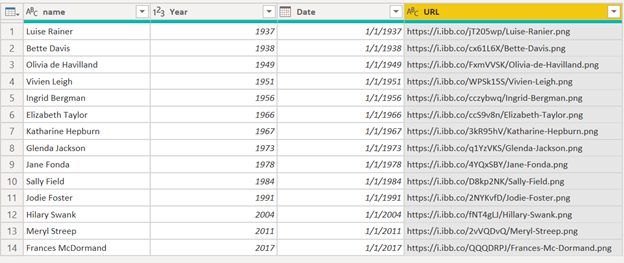
In terms of those minor tasks, it’s just a matter of merging the image URL field from the Actresses table, and turning the year into a date using Column by Examples. Here’s what the final prepped table looks like:
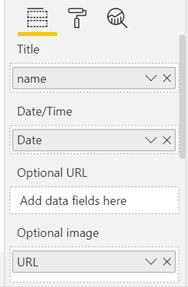
Now we just have to make sure to set the URL field to type Image URL, and then just drop the primary fields into the proper well in the Queryon Timeline visual:
There are a number of remaining formatting tweaks you will need to implement to get the visual looking exactly right. I have posted my solution file earlier in this thread so if you have questions about those formatting options you can look them up in the PBIX file.
I really hope you enjoyed this problem and added a new tool or two to your toolbox. Particularly if you’re not familiar and/or comfortable with M code, hopefully this demystified it a bit and encouraged you to give it a try in your own problems, using the general framework laid out above.
Thanks for participating! We will be back next week with an interesting new DAX problem.
• Brian
 . That’s got it.
 , but give it try to get some ideas