OK, here we go! Problem of the Week #7 is now live!
For background on this initiative, check out this post .
Note: detailed intro video to this problem has been posted on YouTube, and can be found here
Background
As Tabular Editor 3 is about to be released therefore, it is a perfect time to get some hands-on practice in Calculation Groups. With this challenge, you will learn how to:
-
Create Time Intelligence Calculation
-
Create Other Metrics
-
Exclude Specific Measures
-
Apply Dynamic Formatting
-
Use Measures as Small Multiples
-
Sort the Calculation Items
The Model
The Contoso Model is being used for this challenge having a Date Table, Fact Table & One Dimension Table.
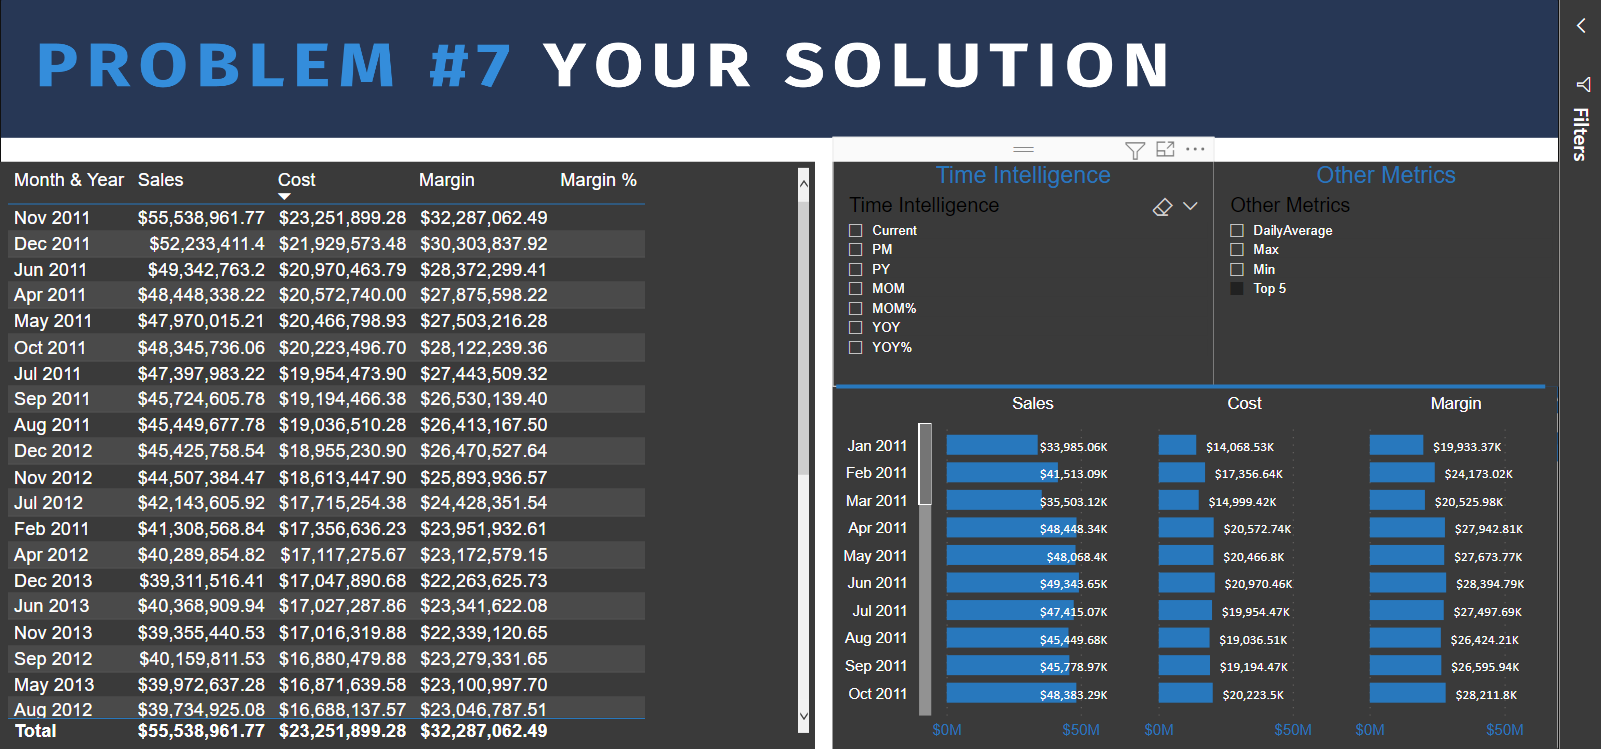
Your Task
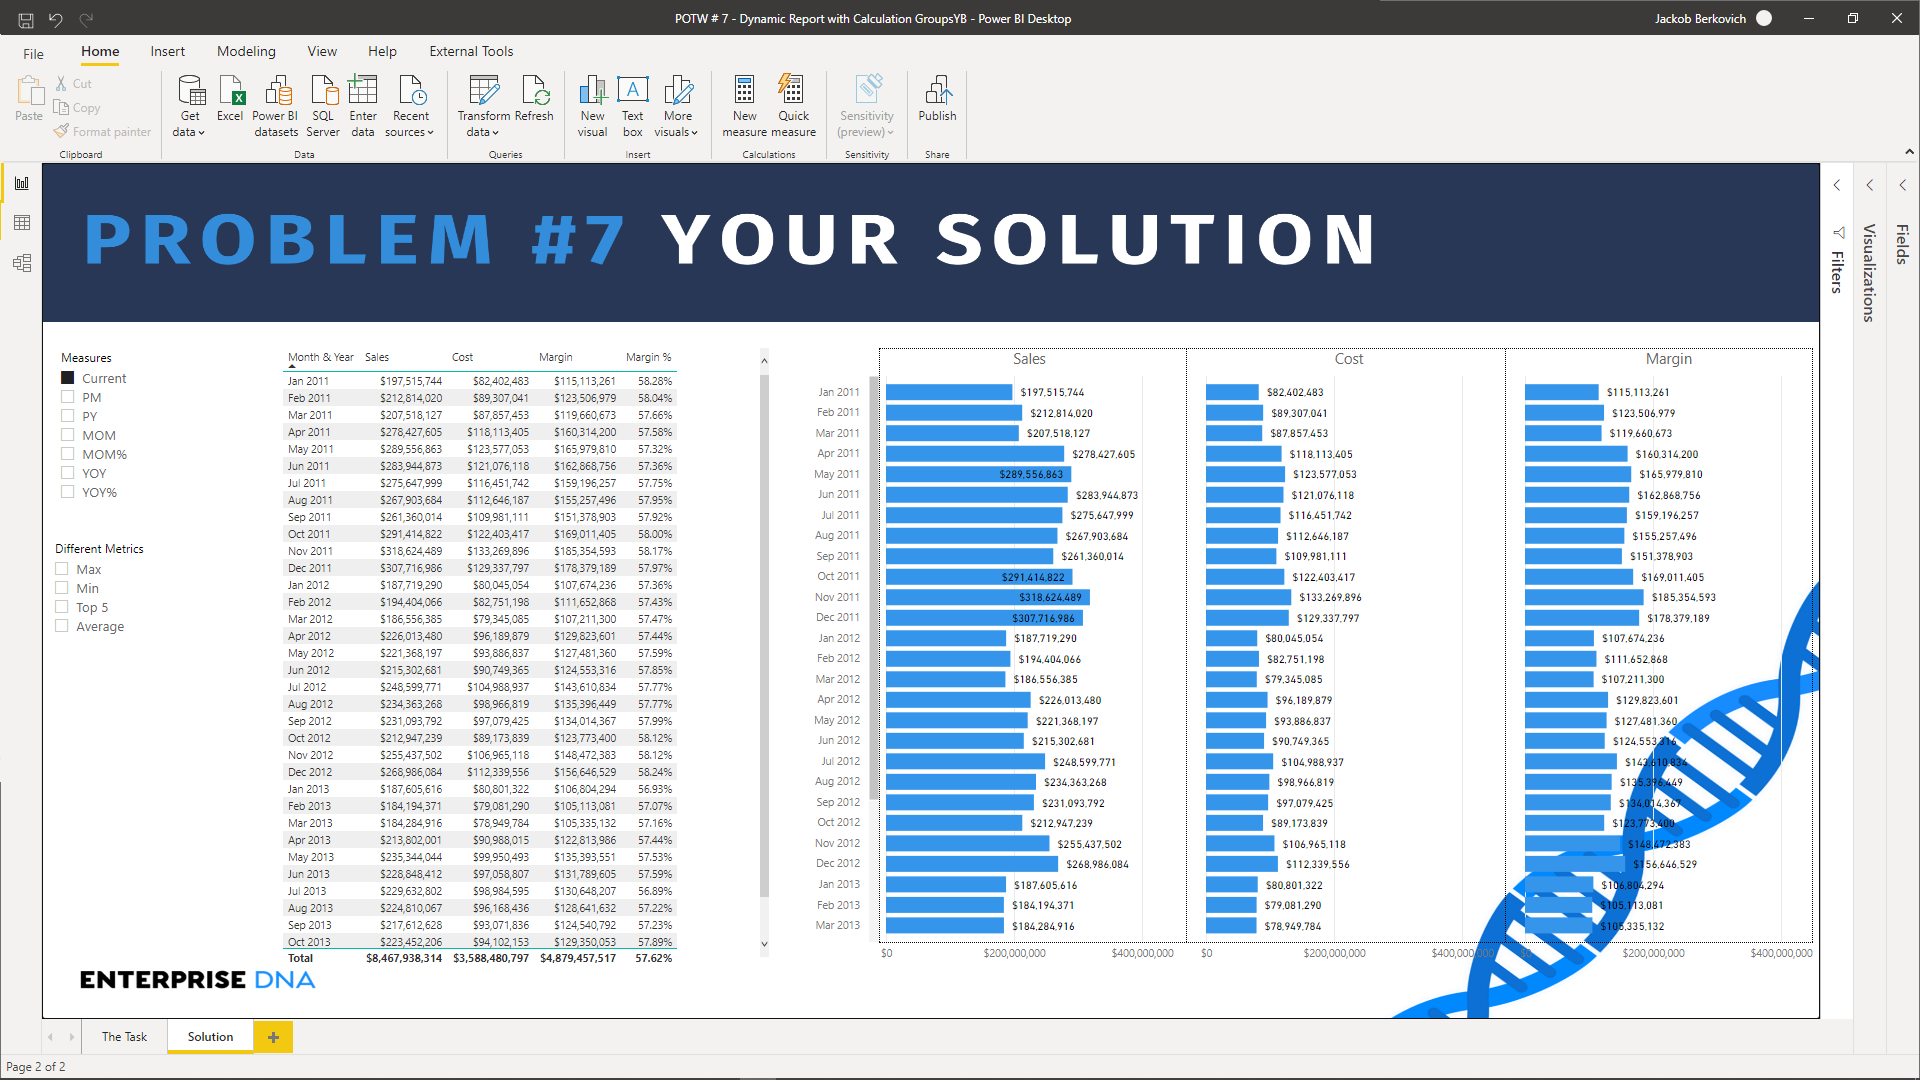
This week’s problem consists of the following requirements:
-
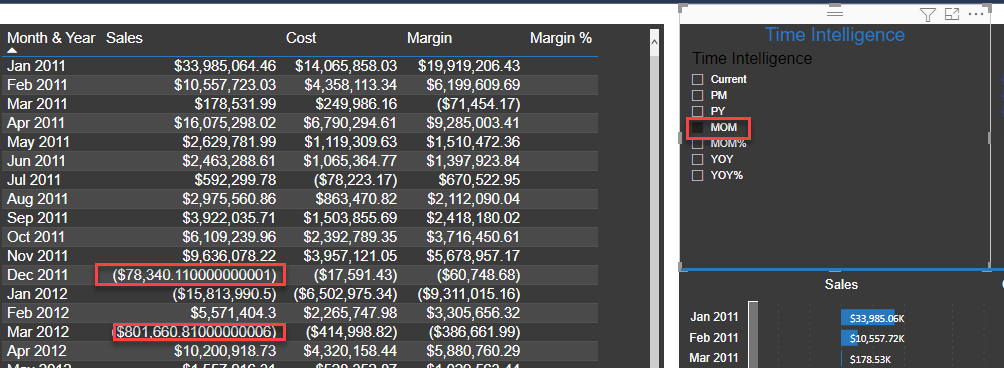
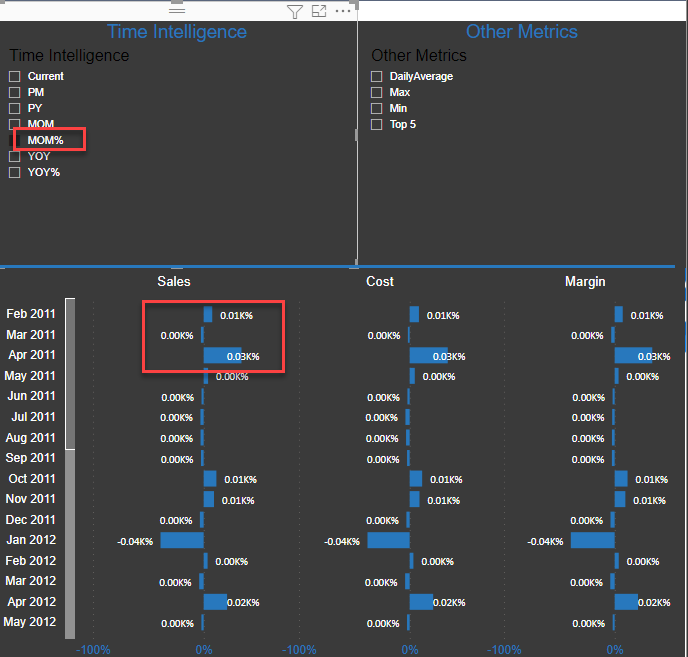
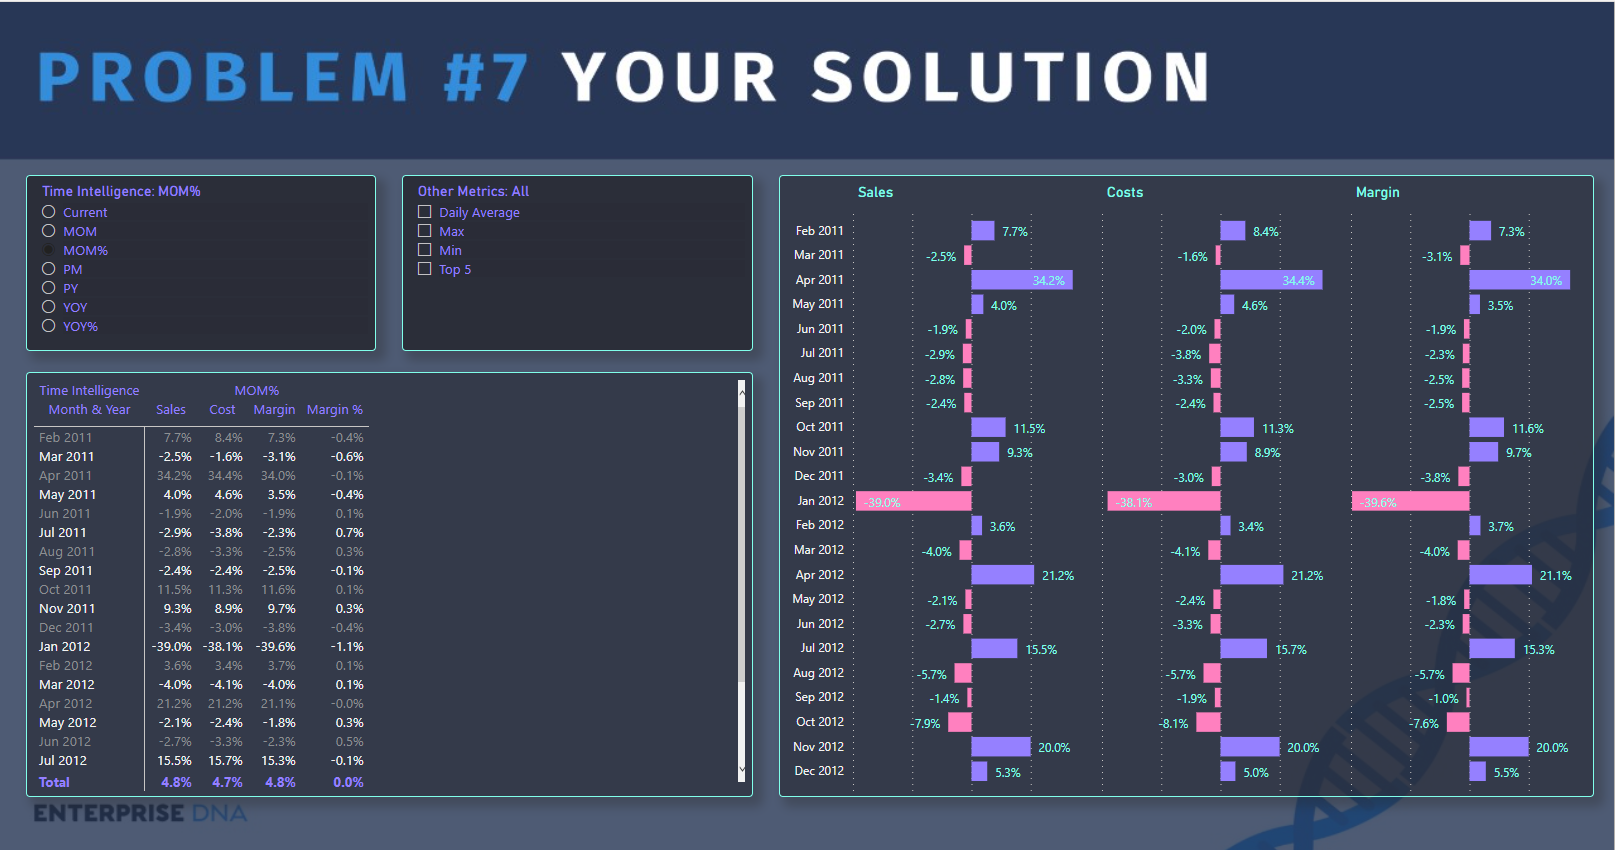
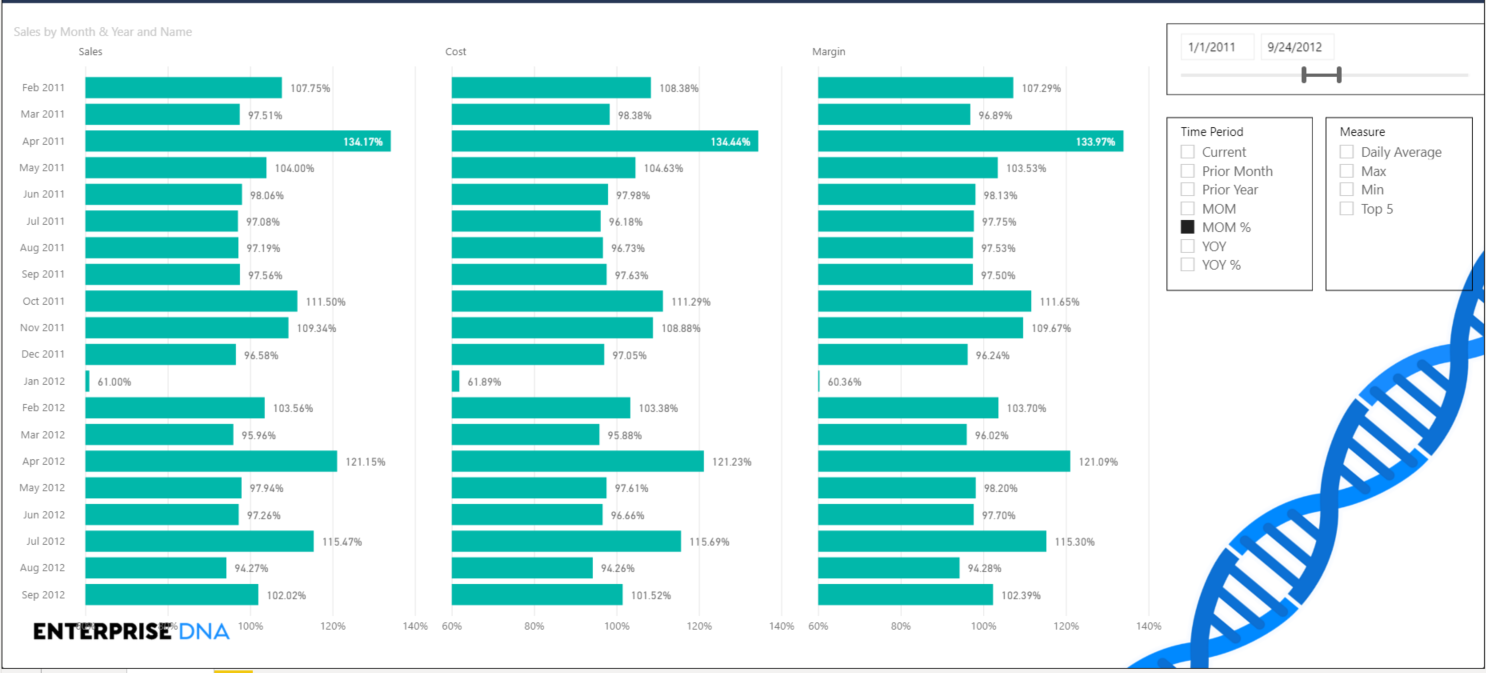
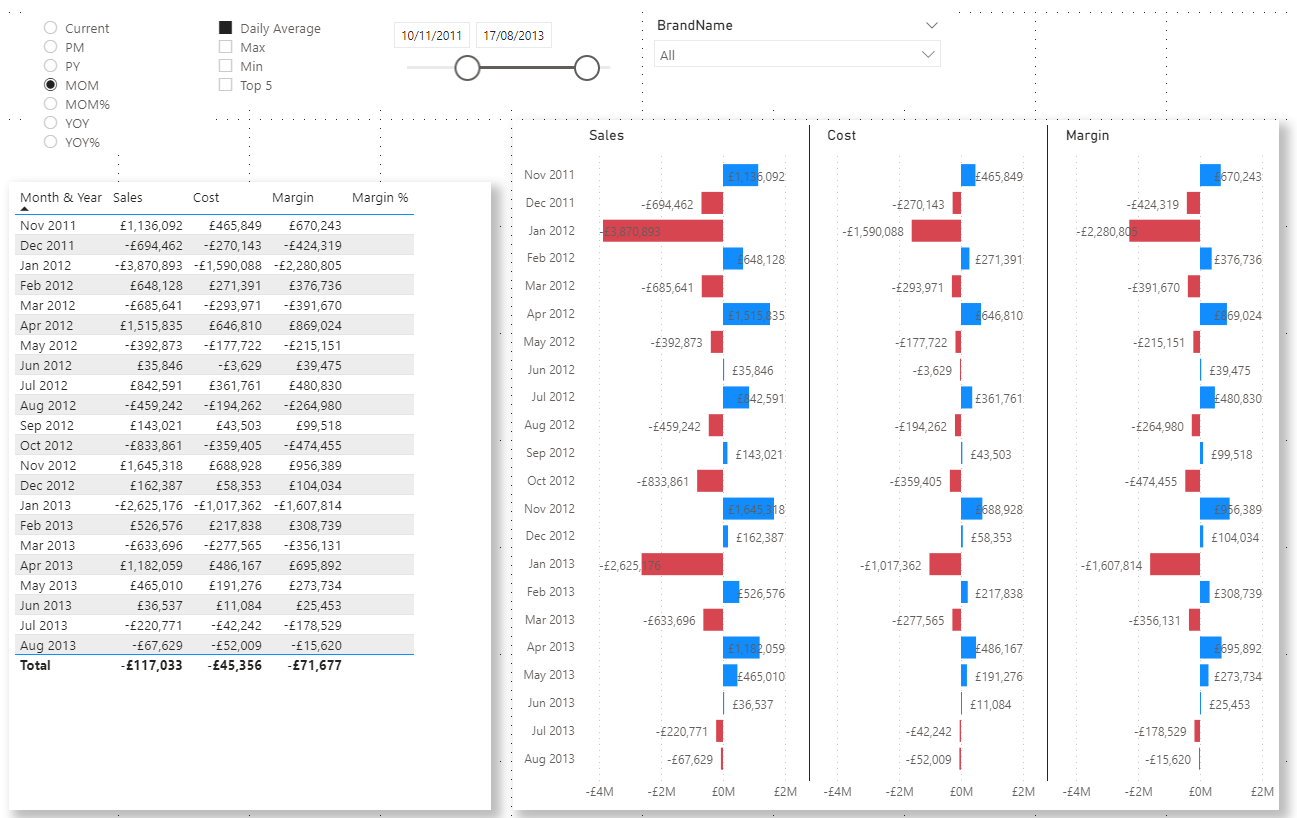
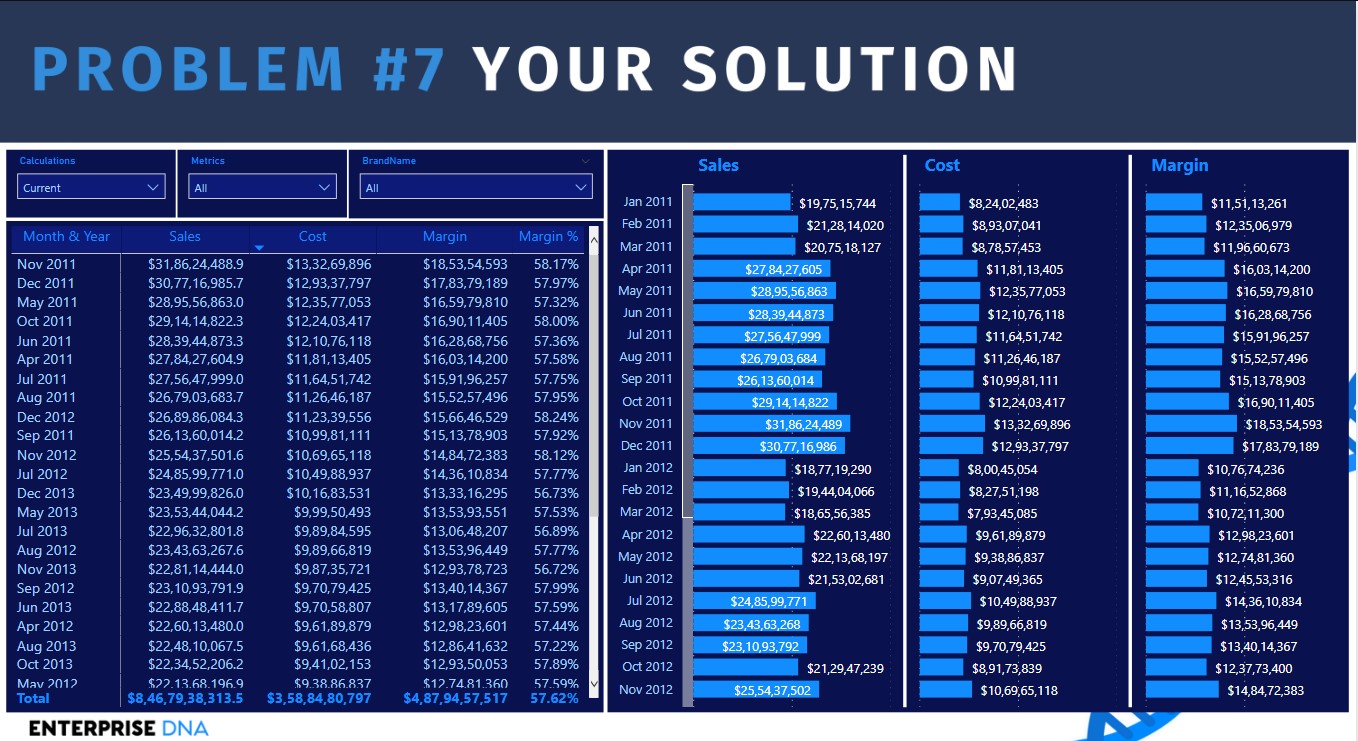
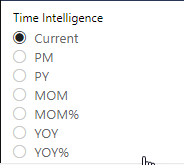
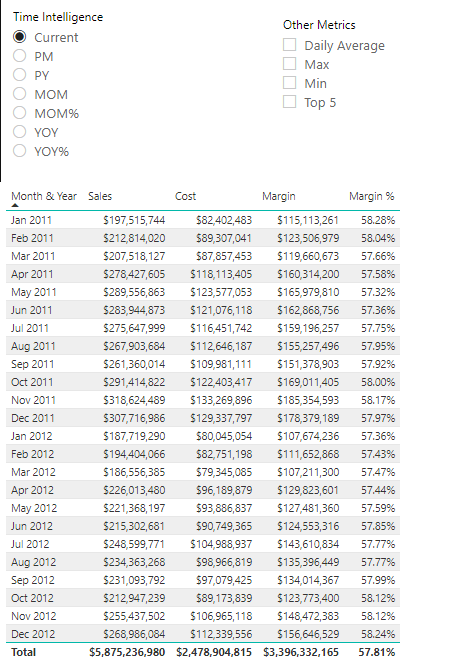
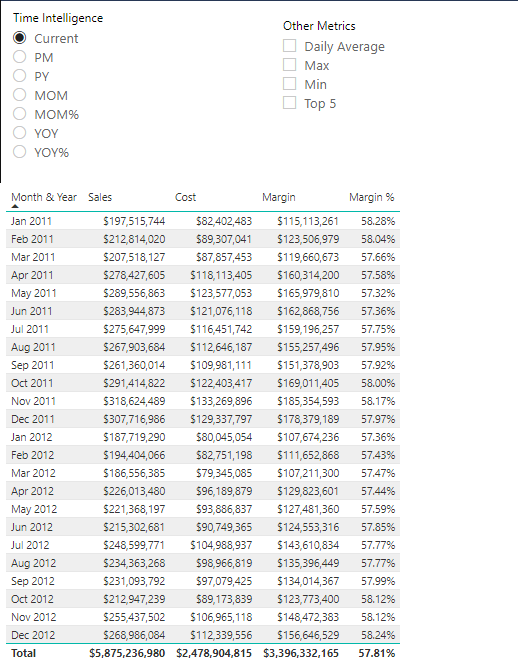
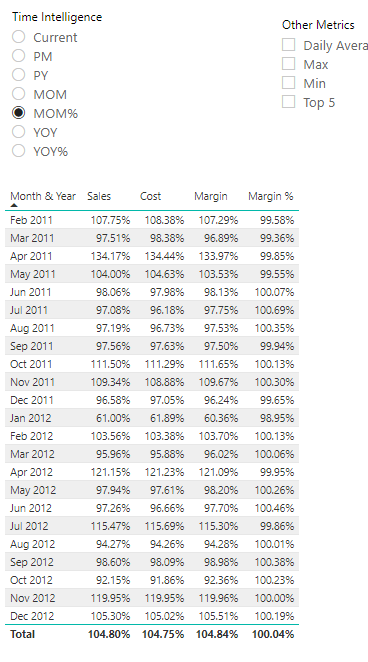
Time Intelligence Calculation with Calculation groups. The calculation items should change the measures dynamically in the report. To learn how to create time intelligence calculation items, refer to the EDNA Video.
-
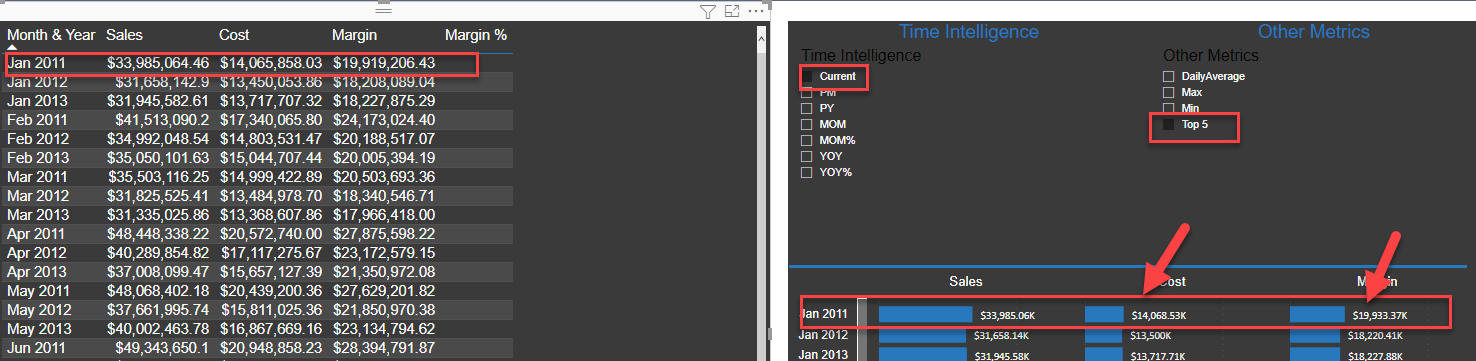
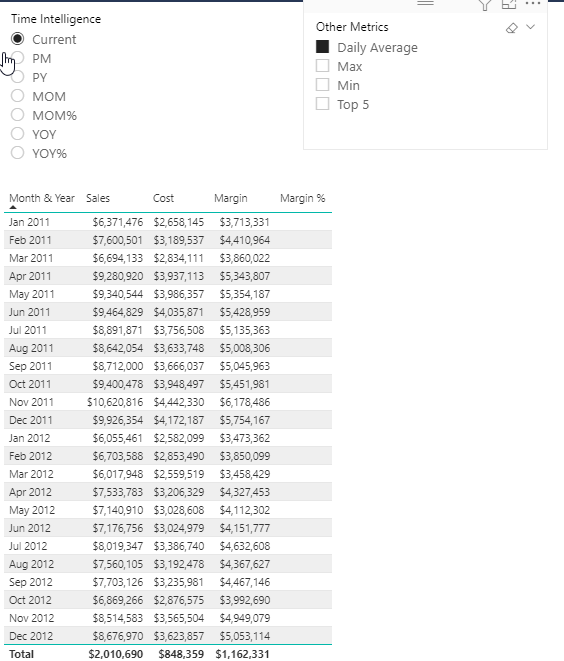
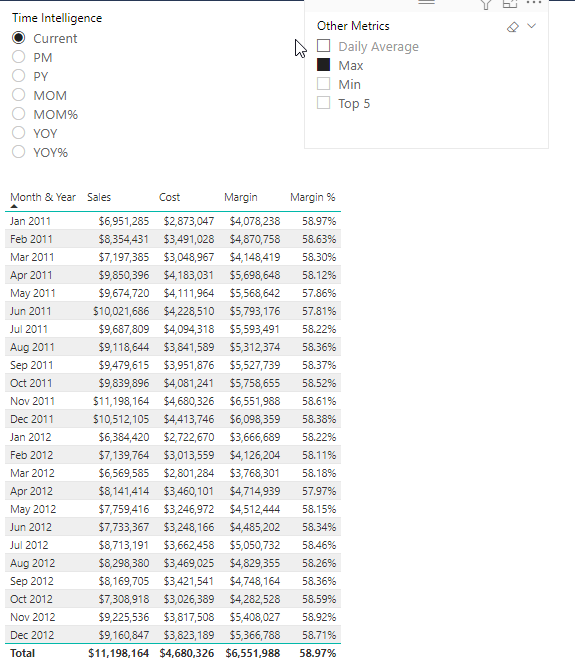
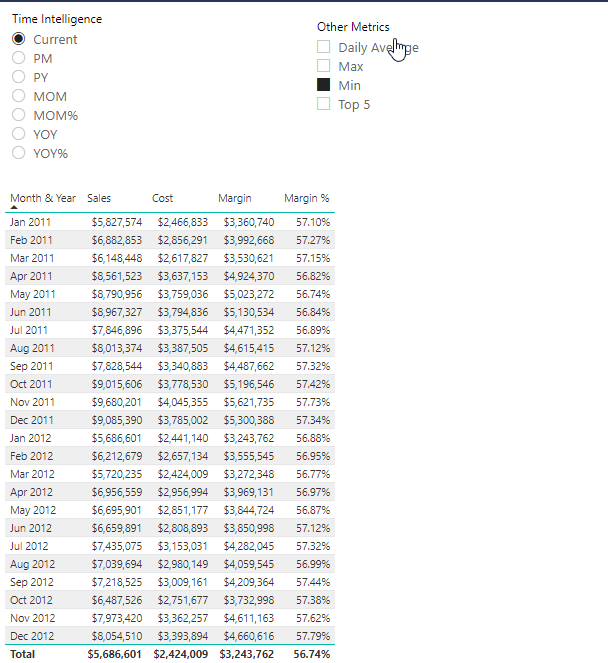
Create Other Metrics. While creating other metrics, it is to be noted that when the Top 5 & Daily Average Calculation Items are selected, the Table Visual Should Not show the Margin %. To learn more about this trick, refer to the functions: ISSELECTEDMEASURE() & SELECTEDMEASURENAME().
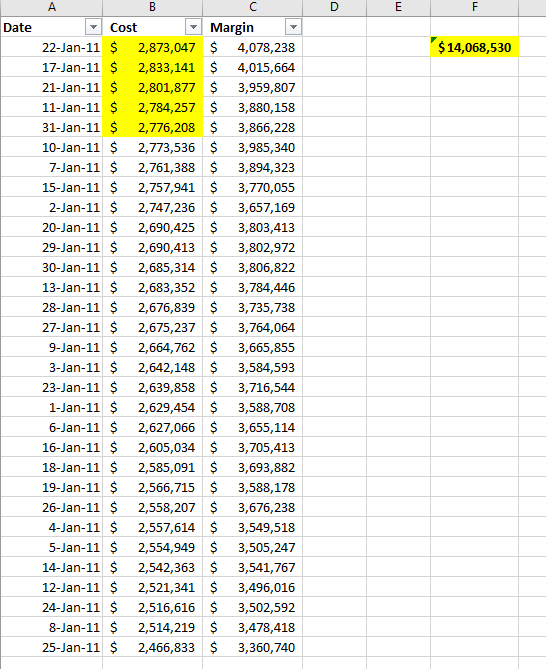
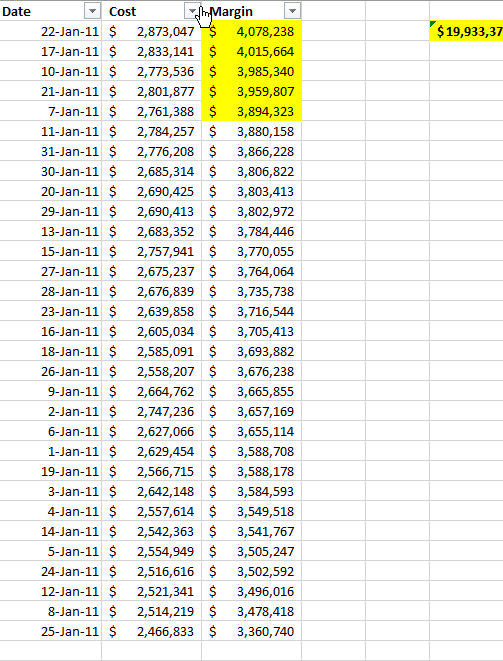
The requirement for MAX & MIN is to get the highest Value or Lowest Value on a particular day in a particular month. For example, if in Jan the highest value is on 14-Jan-2011 then the value of that day is required.
Similarly, the requirement for Top 5 is to get the Top 5 values on a Daily granularity in particular months.
-
Apply the correct format string to Calculation Items.
-
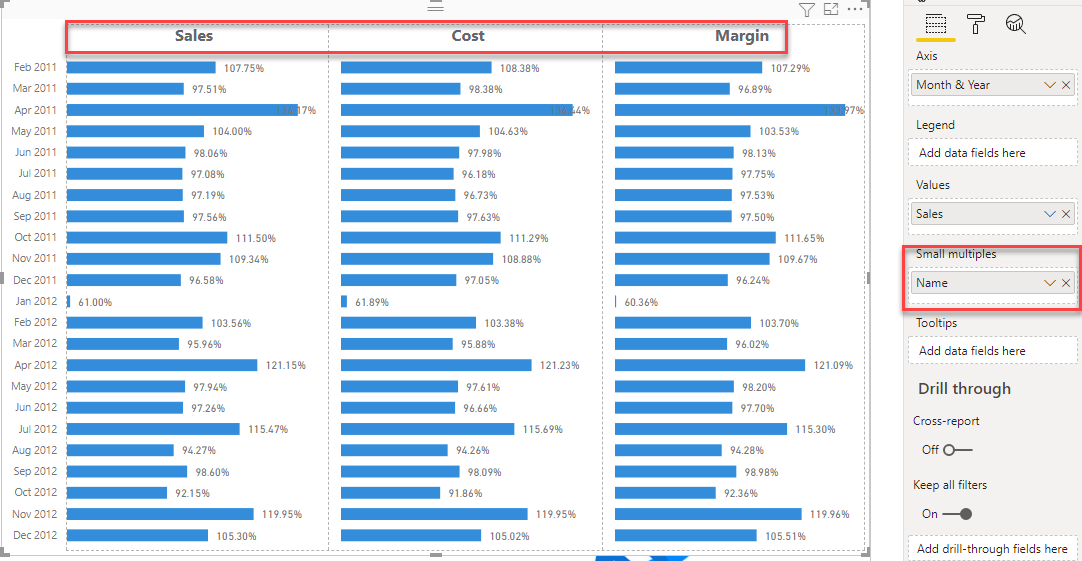
Use Measures as Small Multiples. Refer to the EDNA Video to use measures as categories in the report with the help of Tabular editor.
-
The last requirement is to sort the Calculation Items in Small Multiples Visual in the following order: Sales, Cost & Margin. Refer to the EDNA Video to sort the Calculation Items in Tabular editor.

All in All, 3 Calculation Groups are required for this challenge:
-
Time Intelligence
-
Other Metrics
-
Measures as Calculation Groups
Important
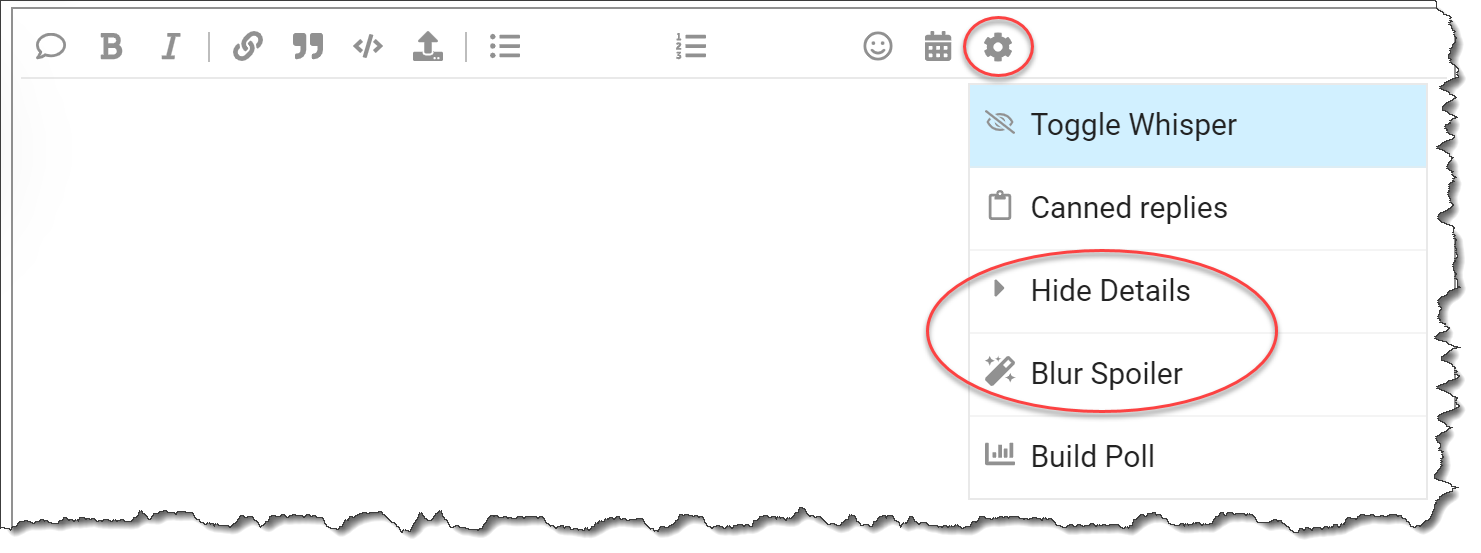
We ask that if you post anything directly related to a solution to please use the “Hide Details” or “Blur Spoiler” options within your post. This will prevent people who have not yet completed their solution from seeing things they might not want to see yet and could influence their solution.
To use these options, just select the text or image you want to hide, click on the gear icon on the top right at the top of your post and select either Hide Details or Blur Spoiler.
Note that this is a DAX-only challenge, so no Power Query even if that is what you would choose to use outside of this challenge.
Eligibility for the Drawing
To encourage participation, we will be doing a drawing of five random participants each round to receive one of these cool Enterprise DNA vinyl laptop stickers:

To be eligible for the drawing, just send an email to problemoftheweek@enterprisedna.co before 11:59pm ET, Wednesday, March 10, 2021 indicating you’ve successfully completed the challenge, and please provide your mailing address for us to send the sticker if you’re selected.
We hope you find this initiative fun, challenging and helpful in continuing to build your Power BI skills. All of the information you will need is contained in the files within this post. If you have any questions or comments, just message @BrianJ or @MudassirAli in this forum thread.
Good luck, and enjoy!!!
POTW # 7 - Dynamic Report with Calculation Groups.pbix (49.3 MB)
P.S. Your feedback is always welcome, and if you have a real-world problem that you think might make a good future Problem of the Week, please email it to us at problemoftheweek@enterprisedna.co.
Thanks!