Problem of the Week #5 (DAX) - Dynamic Last N Weeks Trend

OK, here we go! Problem of the Week #5 is now live!

For background on this initiative, check out this post .

Background

Unfortunately, DAX does not have any Time Intelligence function that can help in handling the week-related calculations easily. Therefore, different custom techniques can be used to handle the calculations over weeks. This challenge provides the opportunity to create custom DAX code(s) required for week-based calculations.

The Model

The model is fairly straight-forward that contains one Date table and one fact table related to the daily COVID cases by countries.

Your Task

This weekā€™s problem consists of the following requirements:

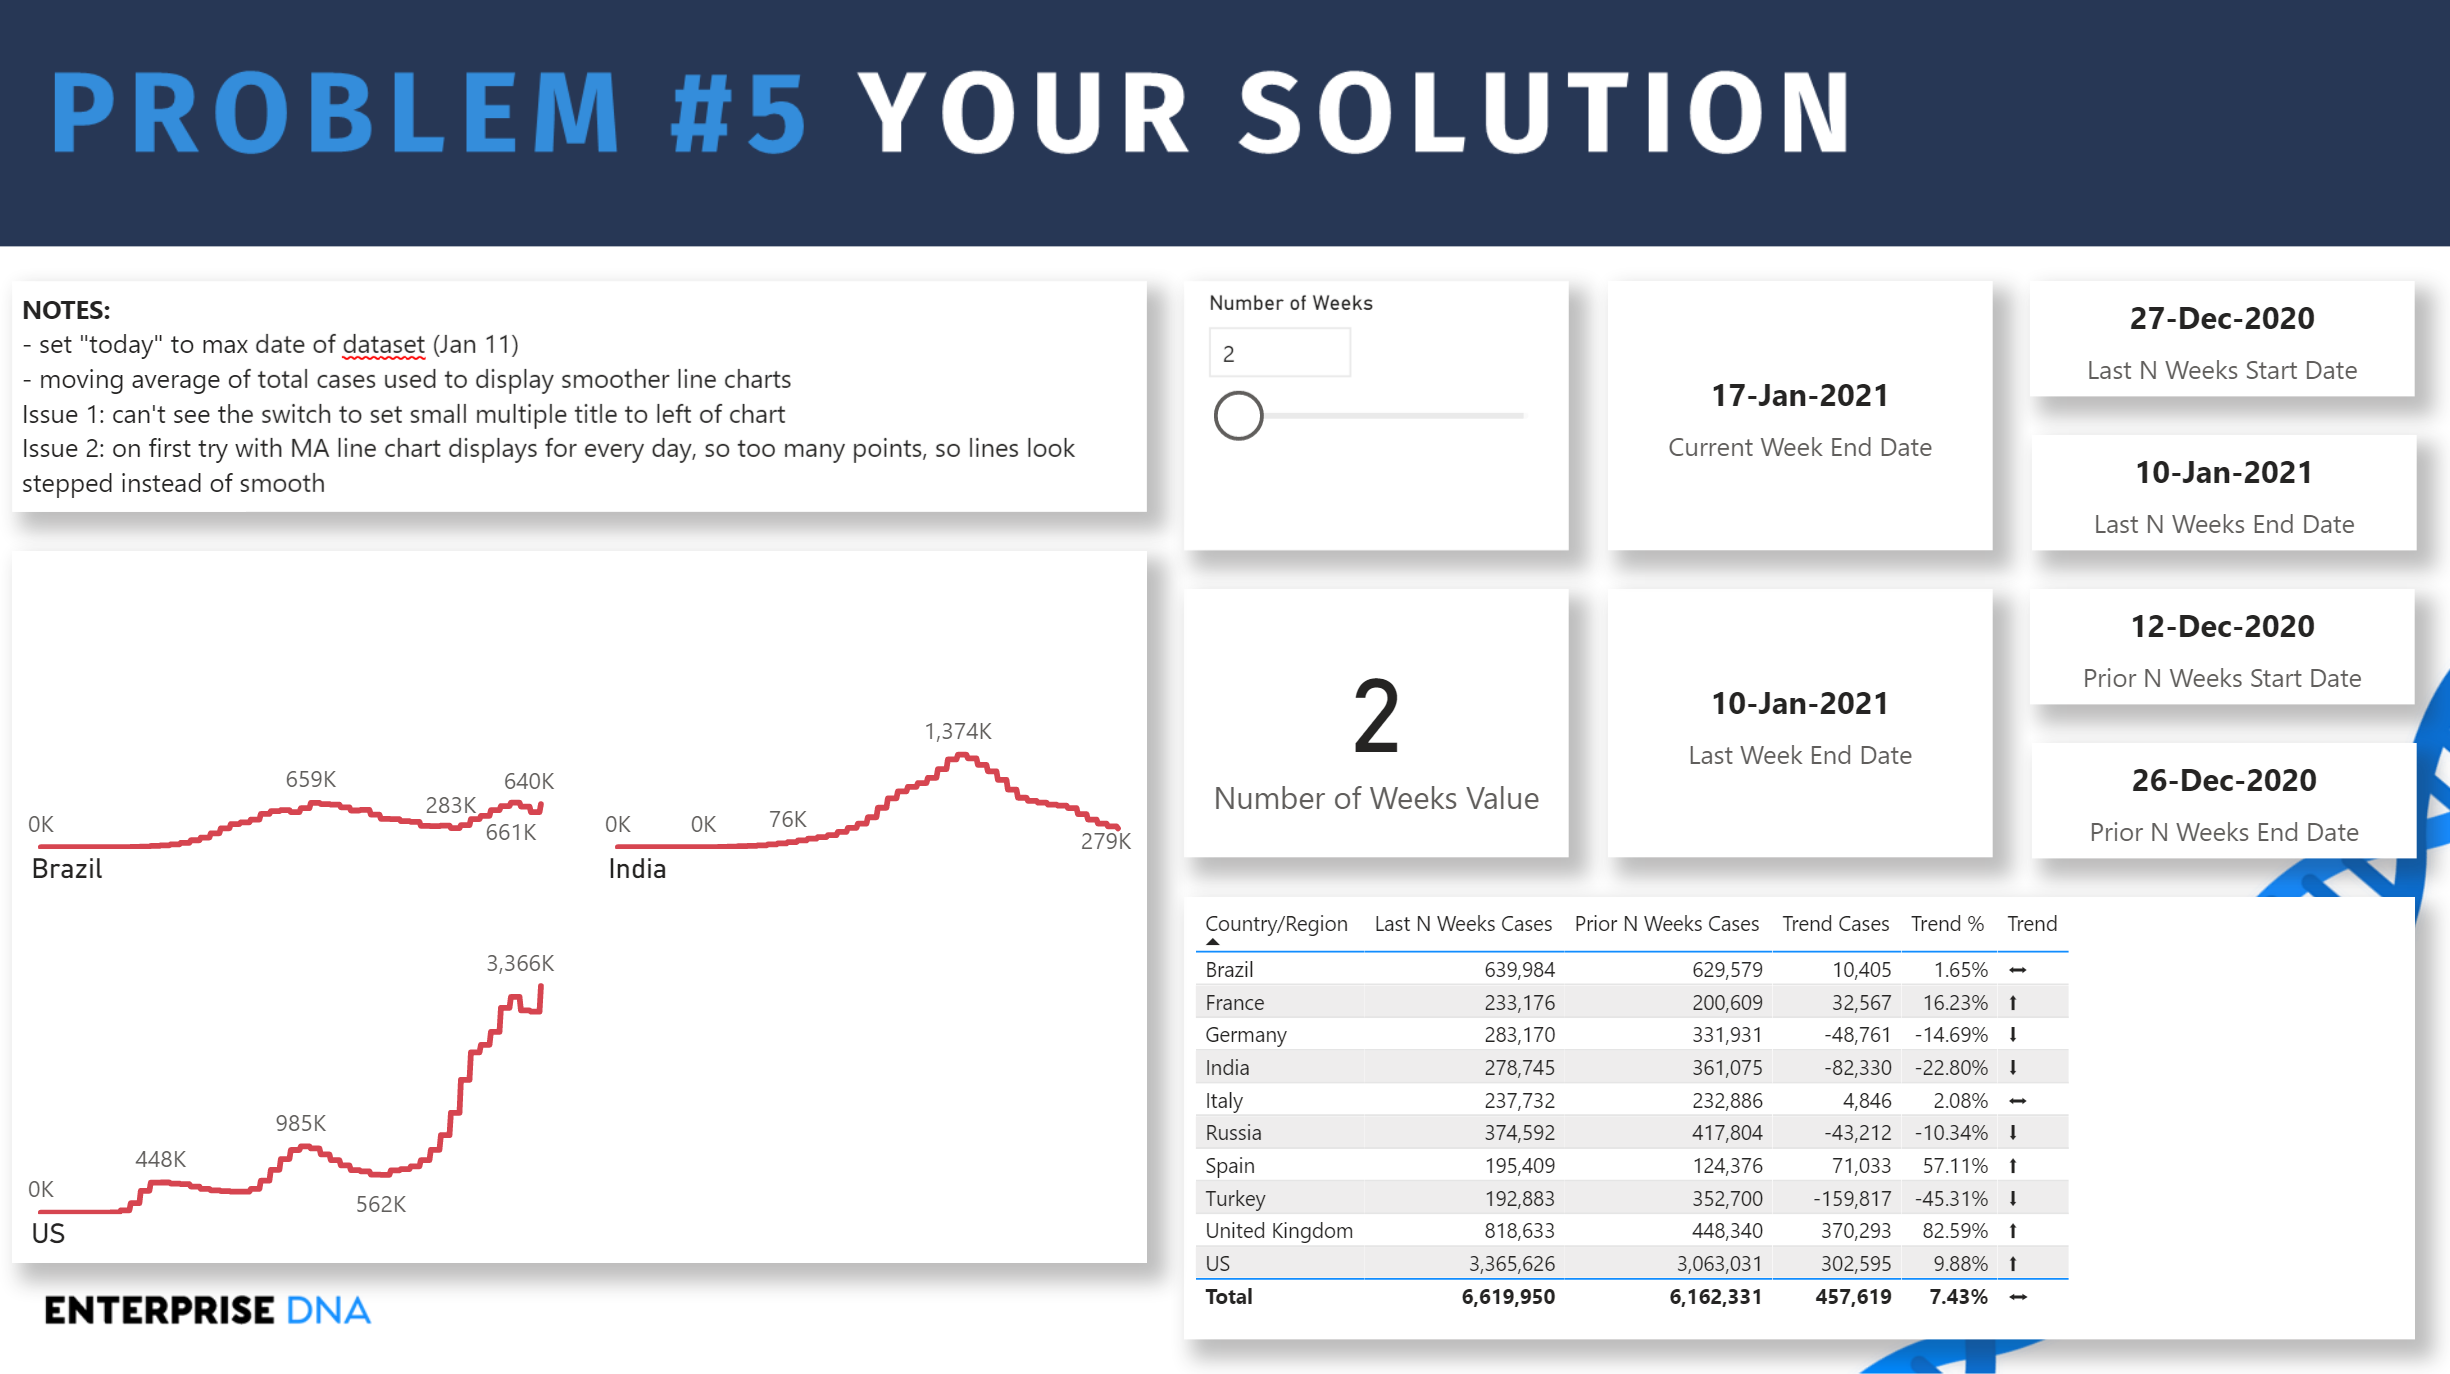
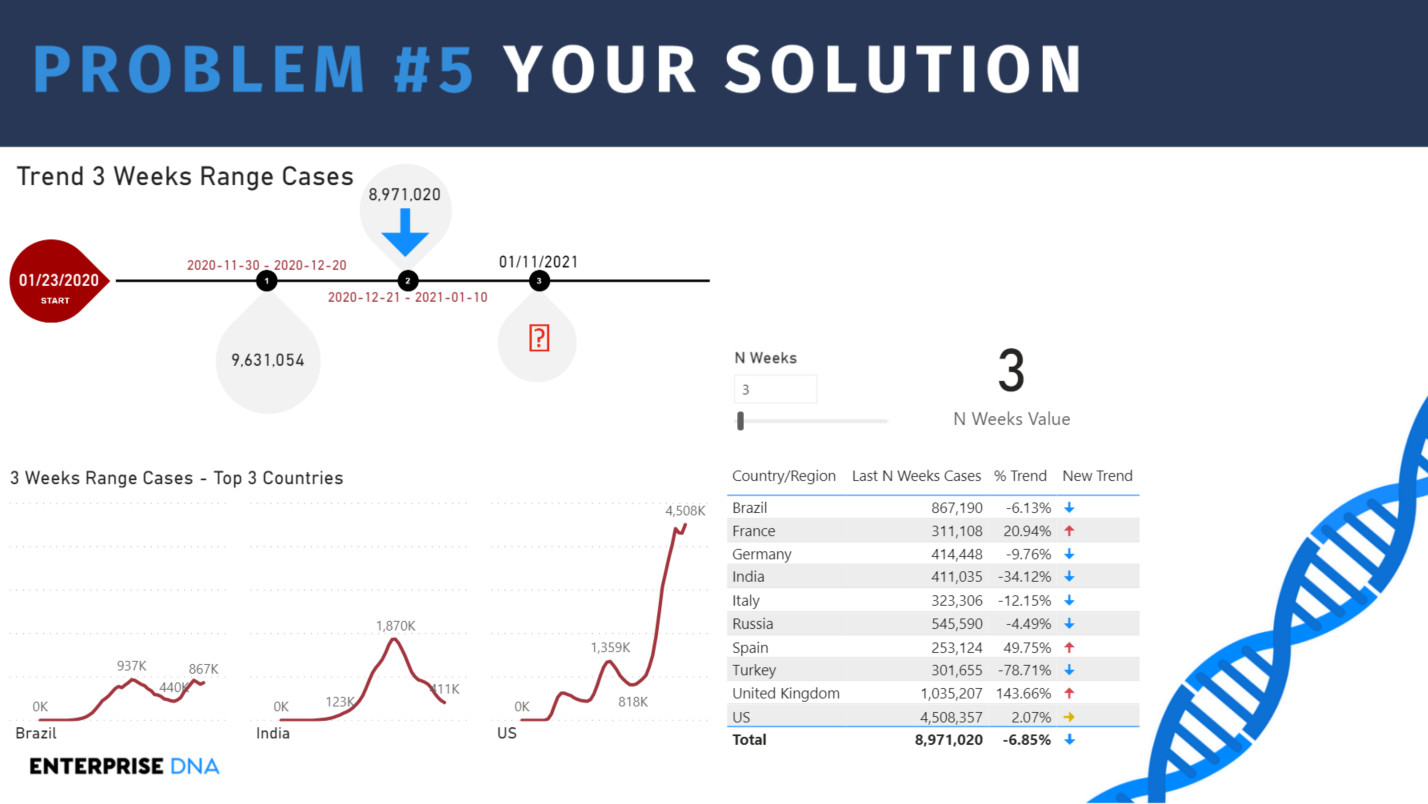
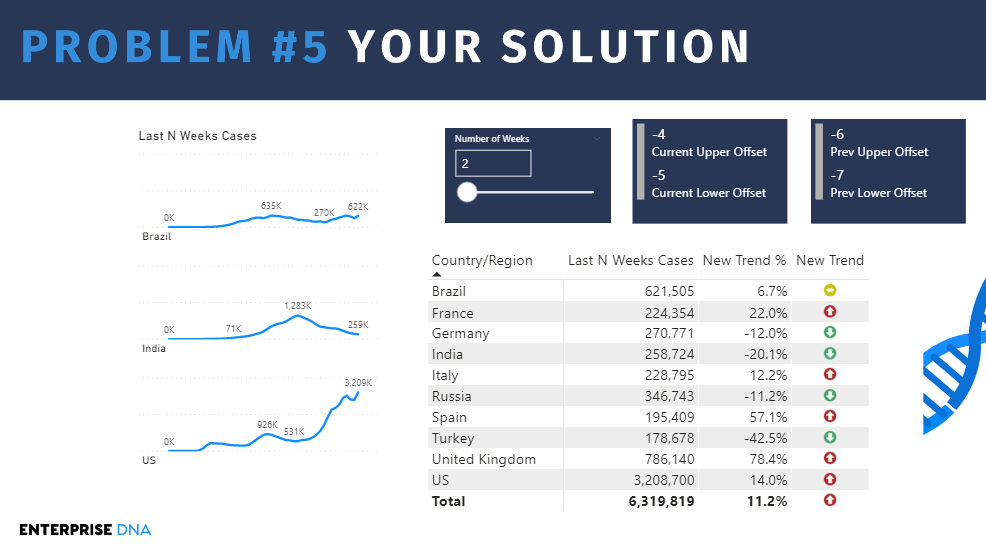
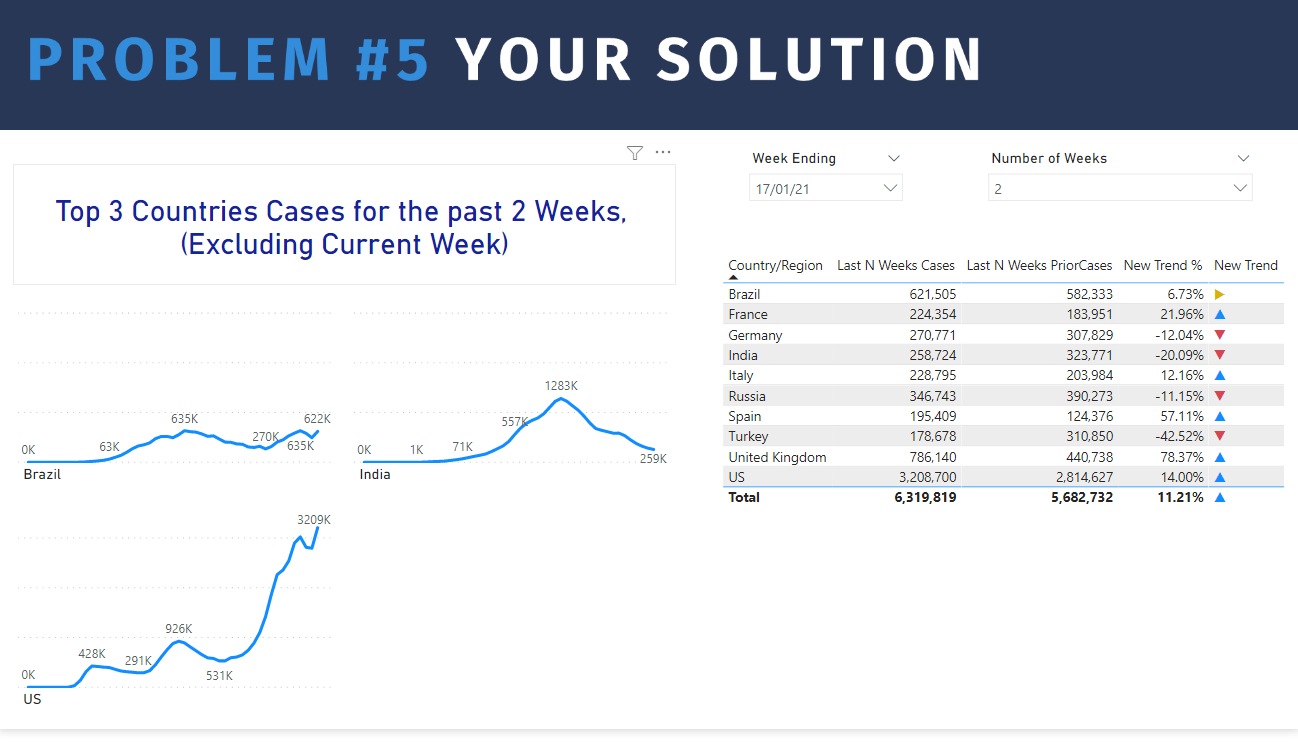
  1. Calculate the Last N Weeks Covid cases excluding the current week. The numbers should change dynamically with the What-if-Parameters selection. The parameter starting from 2 and increasing incrementally by 1 till 28 weeks.

  2. Calculate the Trend %. The trend % is calculated by comparing the Last N weeks with the N weeks prior to the Last N weeks Covid cases. For example, if week # 8 & week 9 are the Last N Weeks then it should be compared with the week # 6 & week # 7 dynamically.

  3. Show the Trend Arrow with UNICHAR or Conditional Formatting. If the Covid cases are
    Greater than 8% then the trend is upward,
    Less than 0% then the trend is downward or
    The trend is stable if is in between 0% and 8%.
    The preferred solution would be to show the trend with UNICHAR Code rather than conditional formatting option. Do you know you can also show the trend with ONE keyboard Command in Power BI?

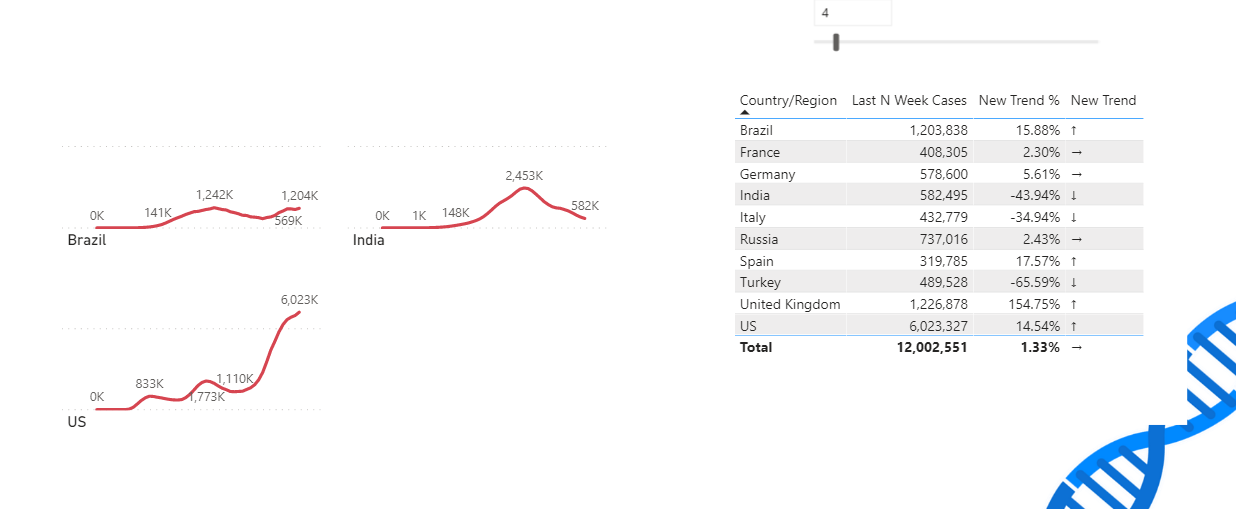
  4. The last requirement is to dynamically show the Last N Weeks Covid cases with Line Chart using the Small Multiple Visual feature. Show by only the Top 3 countries with the most Covid cases & the country name should be at the bottom left side of the line charts.

Important
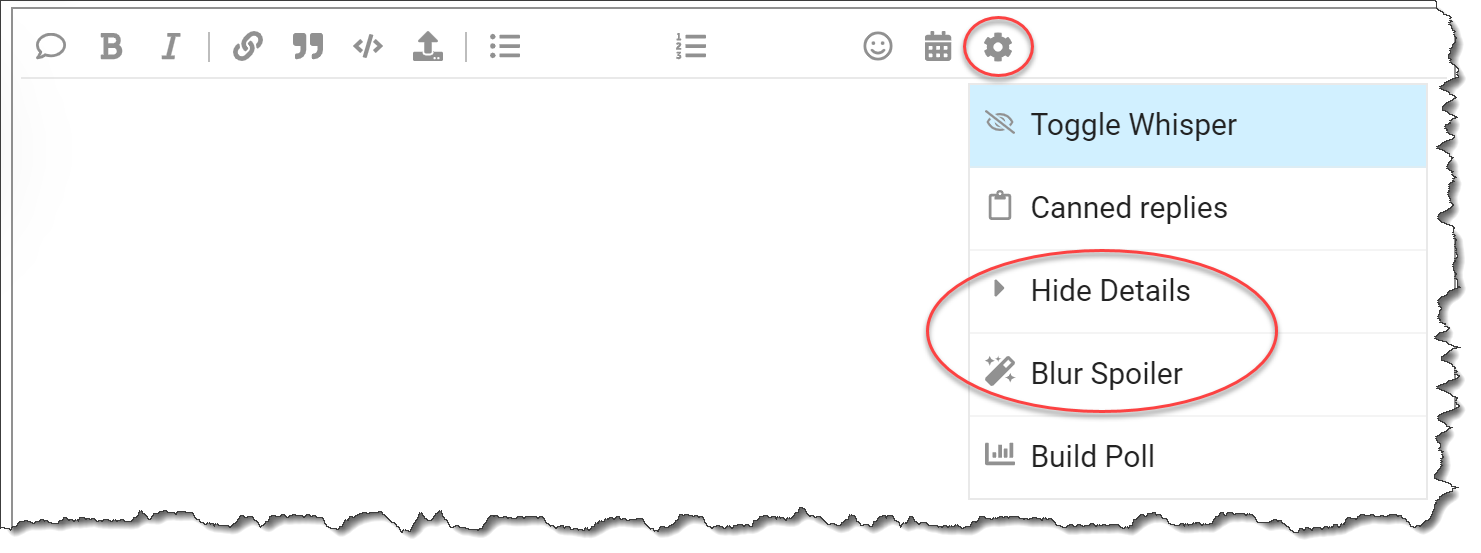
We ask that if you post anything directly related to a solution to please use the ā€œHide Detailsā€ or ā€œBlur Spoilerā€ options within your post. This will prevent people who have not yet completed their solution from seeing things they might not want to see yet and could influence their solution.

To use these options, just select the text or image you want to hide, click on the gear icon on the top right at the top of your post and select either Hide Details or Blur Spoiler.

Note that this is a DAX-only challenge, so no Power Query even if that is what you would choose to use outside of this challenge.

Eligibility for the Drawing
To encourage participation, we will be doing a drawing of five random participants each round to receive one of these cool Enterprise DNA vinyl laptop stickers:
problem solver

To be eligible for the drawing, just send an email to problemoftheweek@enterprisedna.co before 11:59pm ET, Wednesday, February 10, 2021 indicating youā€™ve successfully completed the challenge, and please provide your mailing address for us to send the sticker if youā€™re selected.

We hope you find this initiative fun, challenging and helpful in continuing to build your Power BI skills. All of the information you will need is contained in the files within this post. If you have any questions or comments, just message @BrianJ or @MudassirAli in this forum thread.

Good luck, and enjoy!!!

P.S. Your feedback is always welcome, and if you have a real-world problem that you think might make a good future Problem of the Week, please email it to us at problemoftheweek@enterprisedna.co.
Thanks!

POTW - 5 - Dynamic Last N Weeks Trend.pbix (431.9 KB)

8 Likes

Hi Mudassir

Iā€™m making progress on the first part of this problem - but the COVID cases data table is an imported CSV table that doesnā€™t have any data in it after 11 January - so the answers that I am getting for cases in the last N weeks are rather small - as the last 4 weeks or so are blank.

Should we use the live JHU COVID dataset (from Challenge #11) to provide current data - or could you post a current CSV file that can replace the COVID cases data table in the pbix file.

Chris

1 Like

Hi Chrish. For the purpose of this challenge, you can treat the week of 11th Jan as the current week and then calculate the Last N Weeks cases that are before the week of 11th Jan.

Let me know if you need further clarification.

Thanks.
Mudassir

1 Like

Hello Everyone,

Here goes my solution for POTW-05.

Canā€™t resist representing the solution as a dashboard :grin:

Thanks a lot, @MudassirAli & @BrianJ for this amazing challenge. :+1:

EDNA_POTW-5

I hope that I understood the requirements correctly.

The last date present in the COVID Data is 11th Jan 2021 which is Monday (Weekday-1) thus, I dynamically ignored this data and hence, the last week.

So, the last date in all of the analysis ends on 10th Jan 2021 (Sunday).

I guess this is right as Iā€™ve compared my analysis with that shown in the picture (challenge page).

Similarly, Iā€™ve some confusion on the requirements to calculate the trend percentage, particularly, calculating the prior N-weeks.

However, I moved with my gut feeling and found my answers matching with the snapshot of the solution shown on the problem page. :grin:

Well, Thanks a lot for the snapshot of the solution in the PBIX file. :pray:

Although now the video of the problem is available on the EDNA Youtube Channel, it would be great to launch both video and POTW at the same time, so that, there wouldnā€™t be any confusion. :blush:

Assuming my solution is correct, I am open to any feedback and canā€™t wait to see how others solved this puzzle :grinning_face_with_smiling_eyes::metal:

Also, want to know how we can show the trend with ONE keyboard Command in Power BI :grinning: :thinking:

2 Likes

@MudassirAli

Thanks for the great challenge.

Here is my solution

Summary

POTW - 5 - Dynamic Last N Weeks Trend - Rajesh.pbix (435.7 KB)

3 Likes

Hi All.

Here is my submission for POTW #5.

Summary

POTW #5 - Dynamic Last N Weeks Trend - Greg Philps.pbix (438.3 KB)
NOTES:

  • set ā€œtodayā€ to max date of dataset (Jan 11)
  • moving average of total cases used to display smoother line charts
  • used filter pane to select only Brazil, India, and US in line chart

ISSUES:
1: I canā€™t see the switch to set small multiple title to left of chart, so there underneath
2: on first try with MA line chart displays for every day, so too many points are displayed, and lines look stepped instead of smooth

4 Likes

Here is my solution for this challenge, very timely.
Thanks for the problem,
Sue

Summary

POTW - 5 - Dynamic Last N Weeks Trend @SueBayes.pbix (437.2 KB)image|690x394

3 Likes

@quantumudit,

Nice! Interesting approach on the solution, and bonus points for the attractive animated dashboard. :+1:

Sorry for the confusion on the requirements, but your assumptions were exactly right.

A word about the Problem of the Week intro videos. Originally, weā€™ve been posting these on YouTube concurrent with the posting of the problem on the forum. However, even with expanding the Enterprise DNA YouTube videos to every weekday this year, thereā€™s still a lot of ā€œcompetitionā€ for those daily slots, with a lot of the experts now creating videos, Sam revisiting many of his earlier topics, the podcast video weekly, Data Challenge videos, POTW solutions, etc. Thus, to make room for all the other technical content we want to post on YouTube, weā€™ve decided to move the POTW intro videos to the forum header and the initial post only. However, we definitely will try to get those synced up so that the post introducing the problem and the video accompanying it are available at the same time.

Thanks for the feedback, and also for your enthusiasic participation in POTW.

  • Brian
3 Likes

@quantumudit Thanks for participating in the challenge. There was a delay between uploading the video and posting the challenge on the forum and we are really sorry for that. Moreover, I should have mentioned that it is just a DAX challenge and not a dashboard challenge :smile:

The dashboard literally looks very cool. Bars, Trend% highlighting & Dynamic small Number of weeks header, everything adds a very nice touch to the report. Now I am wondering whether you will participate in Challenge # 12 or not :stuck_out_tongue_winking_eye:

Your DAX solution is equally amazing. Itā€™s always a learning experience seeing other peopleā€™s approach towards solving the same problem.

Well done on this One !

3 Likes

Mudassir

Thanks for the challenge - and for the guidance on using 11 January as ā€˜todayā€™ for the sake of the calculations.

As this is a dynamic solution I thought it best to publish the result to Power BI service - hope this link works.

https://app.powerbi.com/reportEmbed?reportId=e3a192b2-70a8-4b80-9020-ea7434456a9e&autoAuth=true&ctid=05ce1cbd-1d9d-44ba-8c1d-2ff97ee4b6ff&config=eyJjbHVzdGVyVXJsIjoiaHR0cHM6Ly93YWJpLW5vcnRoLWV1cm9wZS1yZWRpcmVjdC5hbmFseXNpcy53aW5kb3dzLm5ldC8ifQ%3D%3D

Of course you canā€™t see the DAX from that - so here is the PBI file:

eDNA POTW 5 - Chris H.pbix (497.7 KB)

Summary

My approach was to use the ā€œWeek offsetā€ column from the date table to provide the weekly basis of the calculation.

As ā€˜todayā€™ was actually 11 January 2021, I set a ā€˜Reference dateā€™ measure to this date and a branched measure to calculate the number of weeks offset from actual today to that reference date. I thought about making the reference date dynamic as I can see some value in being able to run this analysis from alternative starting points - but didnā€™t get round to making this work.

The DAX for the last N weeks and the N weeks preceding those N weeks was not particularly tricky - just a CALCULATE with a FILTER on the weeks being referred to - the hard bit was trying to keep all the Ns straight!

Using Unicode characters in a measure was new to me. I found all of the Unicode characters on - https://unicode-table.com/en/ - but it took some trial and error to figure out which number I needed in the DAX expression (hint: not the Unicode number!)

Using small multiples tables was also a nice new tool to be introduced to - I never would have found it hidden in the Previews without it being suggested here - it could well have been useful for the COVID dashboard challenge. I added a fourth country to the Top N filter so as to avoid a blank corner of the visualisation.

All the best,

Chris

3 Likes

This is my solution for Problem Of The Week # 5

The video helped me understand the problem better, thanks.

POTW - 5 - Dynamic Last N Weeks Trend - jbressan.pbix (453.7 KB)

4 Likes

Attached is my solution to Problem of the Week #5.

Iā€™m getting a huge kick out of how people have started adding individual flair to their entries (@jbressanā€™s timeline, @quantumuditā€™s full dashboard, @Greg going Greg-style challenge entry, etc.). In keeping with the spirit, I used neither the UNICHAR() nor conditional formatting approach for the icons, instead going with custom flaticon.com icons hosted on imgbb.com, one of the techniques I discussed on last weekā€™s membersā€™ event with @sam.mckay.

Summary

POTW - 5 - Dynamic Last N Weeks Trend - @Brianj solution2.pbix (437.1 KB)

Keep up the great work everybody! And thanks to @MudassirAli for a terrific, multifaceted problem this week.

  • Brian
3 Likes

Everyone,

Attached is my completion. Definitely enjoyed this one as I do find that working with time calculations can be somewhat challenging. Here is my solution:

Here is the file:

POTW #5 Final.pbix (436.5 KB)

4 Likes

Hi All,

Here we are wrapping up the Problem of The Week # 5 with more than enough creative solutions to tackle the week-related calculations. I thank you all who participated in the challenge proving once again that there are many ways to tackle the same problem. I absolutely loved how the members presented the solution in a dashboard style format making these challenges even more exciting.

How I Approached the Problem?

If we had the data till the most recent date it could have been easier to tackle the week related calculation however, in practical life, it is not necessary that you have the data till the most recent date. For example, my office was closed in the last week of Christmas therefore, I didnā€™t have any sales or production data when I tried to calculate the Last Week production or Sales. To tackle this problem, I tried to restrict my weeks from the 1st day till the last date in which the data is available i.e. 11th Jan 2021 with the help of the following measure:

Week Offset Upper Limit = 
Var _MaxDate = MAX('COVID Data'[Date])
RETURN
 CALCULATE(
    MAX( 'Date'[WeekOffset] ) -1,
    'Date'[Date] <= _MaxDate
)

Then used this measure (set as variable called _UpperLimit) to get the range of weeks that has the data available till the last week:

CALCULATETABLE(
                VALUES('Date'[WeekOffset]), 
                'Date'[WeekOffset] <= _UpperLimit)

After that used this virtual table inside the TOPN function to get the Last N Weeks dynamically with Parameter selection :

TOPN(
            _WeekNumbersSelected,    //this is a variable for weeks selection SELECTEDVALUE('Weeks 
                                                          Selection'[Parameter])
            CALCULATETABLE(
                VALUES('Date'[WeekOffset]), 
                'Date'[WeekOffset] <= _UpperLimit),
            'Date'[WeekOffset], 
           DESC
)

Once I got the required number of weeks, I used the ADDCOLUMNS to get the total cases for the weeks selected:

Var _vTable =
 ADDCOLUMNS(
        _TopNWeeksSelection,
        "@Cases",
        [Total Cases]
    )

Finally, it was time to sum all the cases that are selected in the Parameter:

Var _LastNWeeksCases = 
SUMX(
    _vTable,
    [@Cases]
)

For the Weeks selected that are before the Last N Weeks, the only change made in the calculation was to take the Week Offset Upper Limit and subtract it from the whatever weeks are selected dynamically and the rest of the calculations were same as above:

Var _PreviousNWeekOfYear = [Week Offset Upper Limit] - 'Weeks Selection'[Number Of Weeks]

For the more detailed solution, you can check out My Video for the POTW 5 solution.

Conclusion

I hope you all liked this challenge and learned something from it as I literally learned a lot from the submissions. Thank you once again for being active and amazing members of ENTERPRISE DNA.

I think that is it from my side & attaching the PBIX file of my solution.

STAY TUNED FOR POTW 6!

POTW 5 Solution - Mudassir Ali.pbix (457.5 KB)

6 Likes

Fantastic work on this everyone, love the concept and the efforts working through quite complex solutions

3 Likes

Thanks a tonā€¦
Glad that you liked the mini-dashboard :smiley:

Yes, I would definitely participate in dashboarding challenges :slightly_smiling_face: Thatā€™s on my To-Do list.

1 Like

Yeah, I can relate the busy schedule as I also go through it oftenā€¦ Its tough :smiley:
Anyway, Iā€™m amazed by the level of participation this week.
So much of learningā€¦

Thanks a lot everyone for the different approaches ā€¦ :slightly_smiling_face:

1 Like

POTW #5 Participants,

My apologies - in the flurry of new content weā€™ve been working on developing and rolling out, I have been remiss in my sticker payout responsibilities. I believe that everyone who submitted a solution for #5 already has been sent one, except for:

@MudassirAli
@Greg

However, if youā€™ve submitted a solution for any of the past POTWs and want me to send you one, just send me (brian.julius@enterprisedna.co) your physical mailing address (please, NOT your email address :grinning:) and Iā€™ll drop one in the mail to you right away. Mine got the honored center spot on my laptop:

Thanks to all for participating. See you over in POTW #6ā€¦

  • Brian
3 Likes

Excited about this cool sticker but, not yet received itā€¦ I got it for POTW-01, however, it might be taking a lot of time to travel to India :smile: :smile:

@quantumudit,

I sent that out weeks ago, so apparently the Postal Service has beamed that one into a parallel universe. Iā€™ll drop another one in the mail to you this weekend.

ā€“ Brian

1 Like