Hello
I work for an international charity and we work with poor older people around the world affected by disasters such as earthquakes, floods, civil war and epidemics such as COVID-19. We conducts a digital needs assessment (survey) to determine their most urgency needs, challenges so that we can provide appropriate support
I am just starting with PowerBI. We normally we do our assessment data analysis with ACCESS and EXCEL but want to move over to Power BI.
We conduct roughly 14-18 assessments annually and the questions are almost always the same so it is possible to do analysis across multiple countries.
The assessment data table has 228 columns. The data is currently analysed in 10 themes namely Health, Disability, Wellbeing, Food, Water and Sanitation, Shelter, Income and Debt, Safety, Access to services and complaints/consultation
Most of the data is text in the form of yes/no questions or multiple text options eg “never, almost always, always etc but there is some numeric data.
Analysis must allow the data to be always sliced by: Age, gender, location, disability, Alone (living alone) etc
In Excel we do many complex calculations for example we might calculate older people who live alone, on chronic medication, medicine about to run out and access to services. For this we use an EXCEL logic formula that returns code words for only the critical cases.
In PowerBI would would use key measures to do the calculations
My questions are as follows
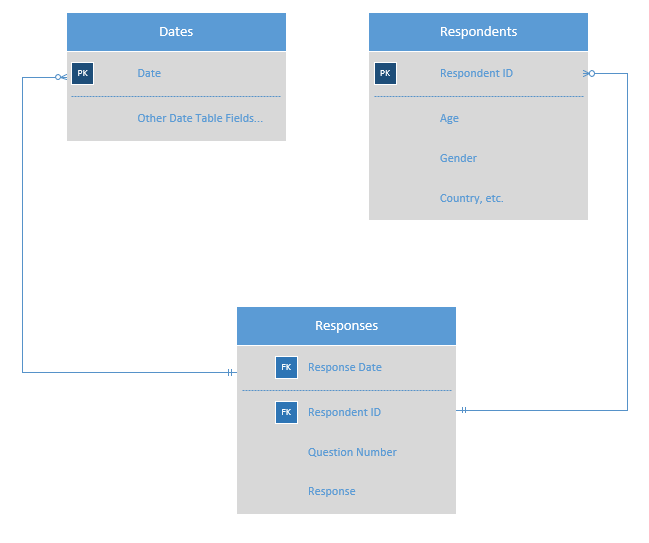
- Do I use just one table with 228 columns in PowerBi or do I use one workbook with 10 sector tables with fewer columns per table but linked by the survey ID number? Please bear in mind the various slicers that might need to be applied to the data e.g. age, gender, disability etc.
- Do is use a separate PowerBI file for each country survey and then when I want to analyse multiple countries I could create a new PowerBI file and append the tables from multiple countries? Would this be correct?
Thanks for your suggestions

