Power BI Challenge - Budget wage

Hi Everyone,

I tried to convert the budget wages calculation from excel format to Power BI. My goal is to set up more dynamic and efficient way to prepare the next year budget, but not very smooth. I can see Power BI is great solution for my work, but it is not easy :astonished:!

Here is my questions:

  1. Why all row total are not correct and the column totals are all zeros.
    Using following measures to calculate
    Total New Wages =
    VAR DPT311=[CN New DL Wages]
    VAR DPT421=[IL 421]
    VAR DPT458=[IL 458]
    RETURN DPT311+DPT421+DPT458

CN New DL Wages = IF([Dept]<400,
CALCULATE([Next Pay Rate][Net PDays]8(1+[% CD DL OT])(1-[% CD LOST TIME])),0)

IL 421 = IF(ā€˜EE Infoā€™[Dept]=421, IF([Metric Month Selected]>ā€˜EE Infoā€™[Next Review Month],CALCULATE([Next Pay Rate][Net PDays]8(1+[% CD IL OT])(1+0.0608)),CALCULATE([Current Pay Rate][Net PDays]8(1+[% CD IL OT])(1+0.0608))),0)

IL 458 = IF(ā€˜EE Infoā€™[Dept]=458, IF([Metric Month Selected]>ā€˜EE Infoā€™[Next Review Month],CALCULATE([Next Pay Rate][Net PDays]8(1+[% CD IL OT])(1+0.0271)),CALCULATE([Current Pay Rate][Net PDays]8(1+[% CD IL OT])(1+0.0271))),0)

  1. I hard coded some parts in formula, Iā€™m not sure how to make it more intelligent such as (1+0.06080) in the following Indirect Labor wages formula

IL 421 = IF(ā€˜EE Infoā€™[Dept]=421, IF([Metric Month Selected]>ā€˜EE Infoā€™[Next Review Month],CALCULATE([Next Pay Rate][Net PDays]8(1+[% CD IL OT])(1+0.0608)),CALCULATE([Current Pay Rate][Net PDays]8(1+[% CD IL OT])(1+0.0608))),0)

  1. How could I apply the second SWITCH function to the calculation to allow to calculate more than one location?

It will be great if you can walk me through what is my mistakeā€¦

Thanks in advance,

Joris

Hi @jorisso, we aim to consistently improve the topics being posted on the forum to help you in getting a strong solution faster. While waiting for a response, here are some tips so you can get the most out of the forum and other Enterprise DNA resources.

  • Use the forum search to discover if your query has been asked before by another member.

  • When posting a topic with formula make sure that it is correctly formatted to preformated text </>.

  • Use the proper category that best describes your topic

  • Provide as much context to a question as possible.

  • Include demo pbix file, images of the entire scenario you are dealing with, screenshot of the data model, details of how you want to visualize a result, and any other supporting links and details.

I suggest that you check the forum guideline https://forum.enterprisedna.co/t/how-to-use-the-enterprise-dna-support-forum/3951. Not adhering to it may sometimes cause delay in getting an answer.

Also, please be sure to check out our DAX Clean Up tool itā€™s a great way to ensure to make your DAX code easy to read. Thanks!

https://analysthub.enterprisedna.co/dax-clean-up

1 Like

Hi @jorisso. Iā€™ve spent a while now trying to tie down your issue, and the penny isnā€™t dropping: I think you data model needs work before we can develop any insights into your 3 questions. I tried applying the Fix Incorrect Totals pattern to generate non-zero column totals (which should work) with no luck. I know that the zeros result because thereā€™s no evaluation context for the column totals, but again, the penny wonā€™t drop.

Would it be possible for you to provide a much smaller sample dataset (say with just a few employees) and just the tables necessary for the matrix

Hereā€™s my work-in-progress so far.
eDNA Forum - Budget Plant Wages.pbix (359.0 KB)

Greg

(P.S. I marked your Calendar table as a date table (you should always do this) and turned off the option for Auto Date/time.)

1 Like

Greg,

Thank you for working on my questions. Yes, I can provide a small dataset for you to work on. Please see the attachments.
Budget Plant Wages.pbix (505.0 KB)
Budget wages workbook.xlsx (159.8 KB)

Many thanks,
Joris

Hi @jorisso. Thanks for the smaller version, but unfortunately it doesnā€™t help to identify the issue. I once again started by marking your [Calendar] table as the date table and disabling the Auto date/time option for this file, but that didnā€™t help either. Iā€™m sure it all starts with the data model, though. I think the problem is youā€™re trying to match a complex Excel report with a single Power BI report; multiple PBIXā€™s with separate purposes that each refer to simple fact tables might be in order. A much simpler dataset and data model would Iā€™m sure help in clarifying the problem. Iā€™ll try to create a simple sample over the next few days and see how that goes. Greg

Hi @jorisso, a response on this post has been tagged as ā€œSolutionā€. If you have a follow question or concern related to this topic, please remove the Solution tag first by clicking the three dots beside Reply and then untick the check box. Also, weā€™ve recently launched the Enterprise DNA Forum User Experience Survey, please feel free to answer it and give your insights on how we can further improve the Support forum. Thanks!

Sorry, I havenā€™t solved my challenges yet, I am still working on them.

Thanks,
Joris

Hi @jorisso, how far did you get your query, and what kind of help you need further?

Hi @jorisso.

Using the Fix Incorrect Totals DAX pattern to handle the different contexts one can accurately calculate cell values, row totals, and column totals in a matrix when using measures and a clean data model.

If I use the pattern to create a separate part for the column total (i.e., only taking into account the inherent cell context and the column context), the column total is correct, while the row total is still incorrect:

Total New Wages 2 = 
IF(
    HASONEVALUE( Employees[Employee Name] ),
   [DPT311] + [DPT421] + [DPT458],
    SUMX(
        ADDCOLUMNS(
            VALUES( Employees ),
            "@DPT311", [DPT311],
            "@DPT421", [DPT421],
            "@DPT458", [DPT458]
        ),
       [@DPT311] + [@DPT421] + [@DPT458]
    )
)

If I use the pattern to create separate parts for both the row total and the column total (i.e., taking into account the inherent cell context, the column context, and the row context), both are correct:

Total New Wages 3 = 
VAR _CellValue = [DPT311] + [DPT421] + [DPT458]
VAR _RowTotal = SUMX(
        ADDCOLUMNS(
            VALUES( Dates[Month Name] ),
            "@DPT311", [DPT311],
            "@DPT421", [DPT421],
            "@DPT458", [DPT458]
        ),
       [@DPT311] + [@DPT421] + [@DPT458]
    )
VAR _ColumnTotal = SUMX(
        ADDCOLUMNS(
            VALUES( Employees ),
            "@DPT311", [DPT311],
            "@DPT421", [DPT421],
            "@DPT458", [DPT458]
        ),
       [@DPT311] + [@DPT421] + [@DPT458]
    )
VAR _Result = SWITCH( TRUE(),
        HASONEVALUE( Employees[Employee Name] ) && HASONEVALUE( Dates[Month Name] ), _CellValue,
        HASONEVALUE( Employees[Employee Name] ), _RowTotal,
        _ColumnTotal
    )

RETURN
    _Result

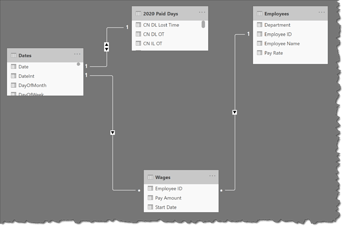
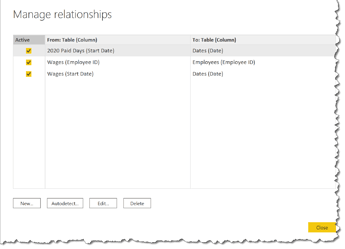
The attached PBIX has full details of my simple sample.

Hope this helps.

Greg
eDNA Forum - Budget Wages v3.pbix (105.1 KB)
eDNA Forum - Budget Wages v3.xlsx (15.0 KB)

2 Likes

Hi Greg,

Thank you for working my challenge. You did give me some new idea to think through this challenge. I like you set up from very simple way. I have two questions:

  1. How to compare the hire date to pay date? I will try to add a hire date column in Employee table to see will that work?

  2. For the Wages table, if we have three thousand or more employees, the list will be very longā€¦

  3. How to apply the Indirect Labor - Vacation Coverage calculation in the setting?
    image

Highly appreciated for providing good insight,
Joris

Hi @jorisso.

Your welcome, and I hope my simple sample with placeholder calculations is easily transferrable to your solution. Iā€™ll reiterate that Power BI should not be viewed as a direct replacement for an Excel workbook; strive for the simplest data model you can, with only raw data in your tables, and use the measure branching technique to layer simple calculations to gradually build-up your measures. This will undoubtedly make your development, validation, and future enhancement much easier.

As to your follow-up questions:

  • For your #2, yes, it will be quite busy in a matrix with over 3,000 employees; perhaps you can add one or more slicers to filter the employees (department?) into smaller, more manageable ā€œchunksā€?.
  • For your #1 and #3, I donā€™t see a question in there for which I can provide insight, but in any event, these will be applied according to your business rules.

Good luck with your development.

Greg

Thanks Greg, I will do more testing on your model.

Joris