Power BI Challenge 7 - Purchases, Inventory And Sales!

@Amdi,

Nice work on your entry! I agree that this was the most difficult challenge to date in terms of data modeling. You and I had a very similar approach in terms of building a single end-to-end fact table.

I always feel that entries present better when they are published to web, so that people can test them out hands-on. If you don’t have the ability to do this within your tenant, just let me know and I’m happy to publish it out for you and send you the link.

  • Brian

P.S. this offer stands for any other participant who doesn’t have publish to web capability. Just let me know if you need a link.

4 Likes

Everyone,
Having missed the first six, I was determined to get one in. It is great to see all the different examples out there. This one was definitely a challenge from getting the data to a more usable format. The approach I took was:

  1. The Purchases and Receiving Tables were joined in Power Query; However, this was just an intermediary step as there were transactions for the same PO and same Material on the same day. This table was therefore hidden, and a new table (Purchasing and Receiving Summarized) was creating using the SUMMARIZE function in order to consolidate any transactions on the same day.
  2. In reviewing the Billing table, there also appeared to be transactions on the same day for the same PO and same Material. A new table was created also using the SUMMARIZE function called (Billing Summarized)
  3. In order to obtain unique PO numbers, a table was created in Power Query to only keep the “Purchase Order”, “PO date”, and “For Customer” fields. All duplicates were then removed.
  4. A separate table of unique Material values was also created.

As for tracking delivery times – this was definitely a challenge. I opted to develop a table to show when portions of the material was delivered.

I also added drill through pages to provide details on each PO (second picture), Material (third picture), and Clients (not shown to save space).

8 Likes

@tweinzapfel,

Excellent report. I particularly like the drilldown and profitability analysis at the materials level – haven’t seen that in other entries. Great to see some new participants this round, like yourself and @kirank.gh. I don’t think there’s a better way to learn and improve Power BI skills than regularly participating in these challenges.

Thanks for jumping with a terrific entry, and hope to see you in future challenges!

  • Brian
3 Likes

@BrianJ - thanks for the note. Definitely looking forward to the next one.

@BrianJ
On my submission have a link to web Power BI Service.

@BrianJ
I have done it after your comments.

1 Like

Well done everyone, fabulous entries. Amazing to see such diversity in report techniques

Wow Brian, so impressed by your analysis…the timeline chart! Love this visual.

This is really magic.

Well done

Sam

2 Likes

@sam.mckay,

Thanks so much - that really means a lot. Sometimes, you get a flash of inspiration and things just really come together and you’re able to execute the report just as you’d envisioned it. Seems like that happened for you on challenge #6, and I felt that on this one.

  • Brian

Thank you for your feedback Brian! I really appreciate your kind words ! It boosts my motivation to improve even more!

@Hideo, your report is very creative! I also like the interactions, the tooltips, the overall theme and the fact you kept it simple and to the point! Great contribution! :slight_smile:

1 Like

Hello everyone this is my data model for challenge 7. At the moment, i am struggling to calculate the date diffs between the PO dates in the Purchases table and Posting Date in the Received table.
And also calculating the diff between the Bill Date in the Billing table and the dates in the received table.

Any clues will be greatly appreciated

@alexbadiu,

Thank you so much for a nice and warm feed back, especially from like you who got on the top of effort and talent of this challenge series.On this report, I felt like why I am doing this complex and time consuming alignment etc…but now it all paid off :blush: Thank you again for your comment.

All the best

Hideo

1 Like

@amal.rebai1995, I really like your report ! The information you chose to present is useful, clear and straight to the point. I also like the groups for sales and billing.
When I started looking at your report I thought that the groups should have been sorted by number of days, but after couple of seconds I realised that it’s actually better to present it as it is.
For the improvement side, I think that the report could look better without the blue line around the different sections and by taking off the red colours of the table. I think that the white space and the limited colour will only emphasis even more the insights.

@Eze You can create active relationships between dates and can also look at @sam.mckay model for reference. I used the lookupvalue function to create additional column in “Received” extracting PO Date from “Purchases”. Then you can calculate the difference between the dates.

OR

You can also look at @BrianJ write up as to how he built his model for this challenge.

2 Likes

WOW!!! Awesome work everyone you’ve really made it easy for me this week :worried:!!!

No but seriously the knowledge share and vast array of ideas on display is immense.

Some epic write ups too appreciate you all putting in the effort to make these challenges a success.

Loads to come in the wrap up shortly, speak soon.

Haroon

4 Likes

@MudassirAli, great and thanks a lot

A little late to the party but hope this finds everyone safe and healthy.

I revised this a few times and sure it can be tuned even further but I think I covered all the requirements.
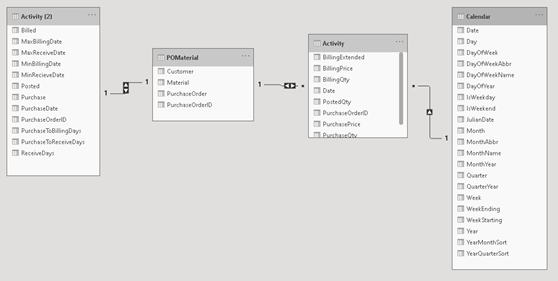
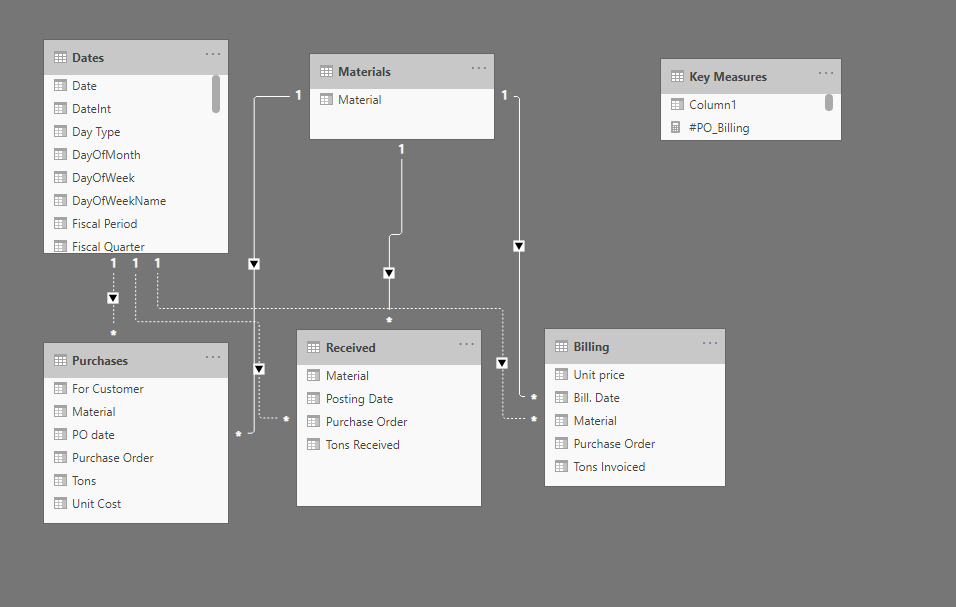
DATA MODEL

Like others noticed PO and Material were in every table but also the customer because its tied to the PO. Where customer was not specified, I used “Unknown”. I cheated a little by creating the PO, Material, Customer table in another excel sheet. I could have done this with power query but if this were a database, I would have done this with SQL.

So, we have a conforming dimension which ties to all the fact tables (purchasing, receiving and billing) and lets us drill through across the different fact tables. We can use bidirectional relationships because there are no ambiguity issues, and we adhere to strict 1:M rules

I wanted to see how each fact progressed over time and since each fact has a date, I created an Activity fact, each date we see what happened across purchases, posting and billing.

The other activity was the days between each process – purchasing to posting, posting to billing along with the first/last date of each process – all this broken down by customer, PO and material. This is Activity 2 (didn’t take the time to come up with a better name for this table).
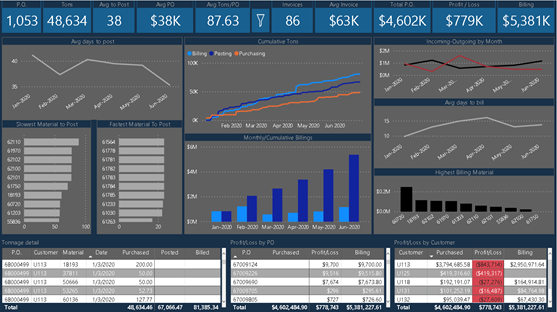
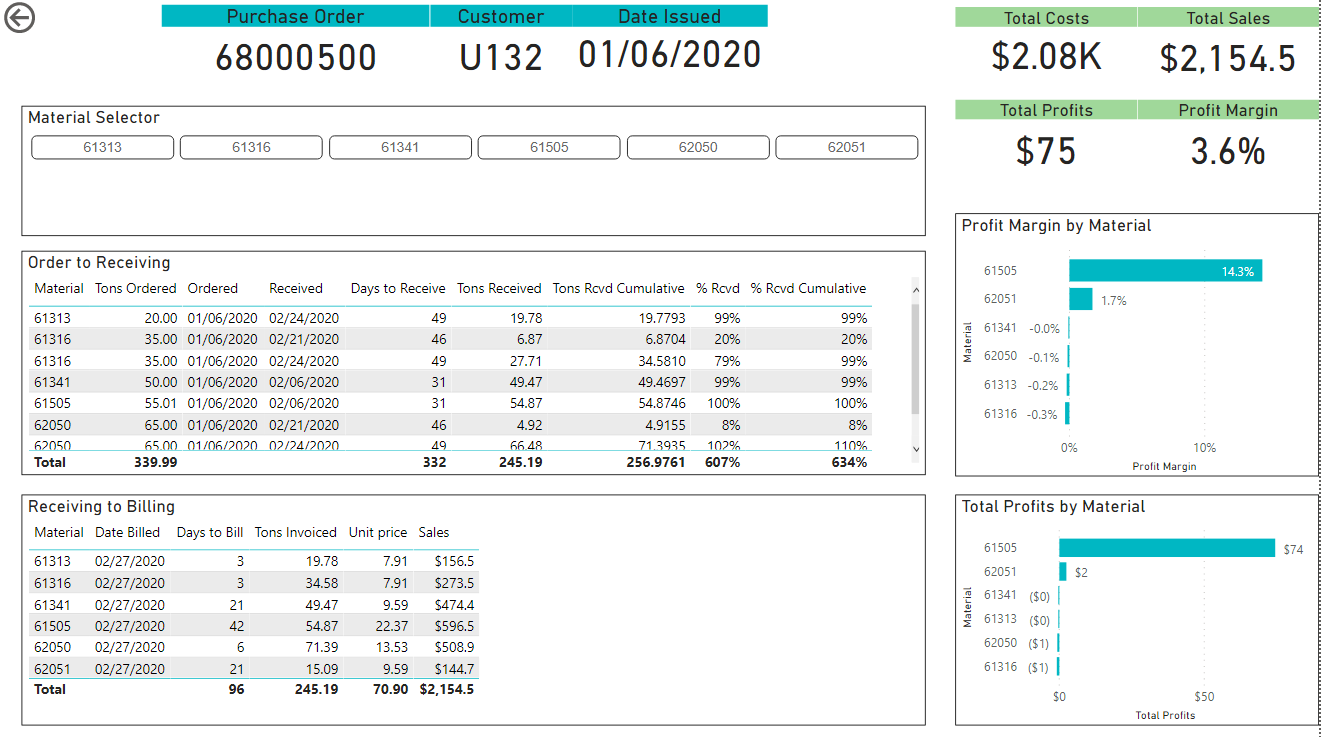
VISUALS

I concentrated primarily on the requirements but also considered “what would I want to see” and came up with the avg purchase-to-post visuals with the top & bottom 10 performers. I like to see KPI at the top, visuals next and finally some aggregated detail.
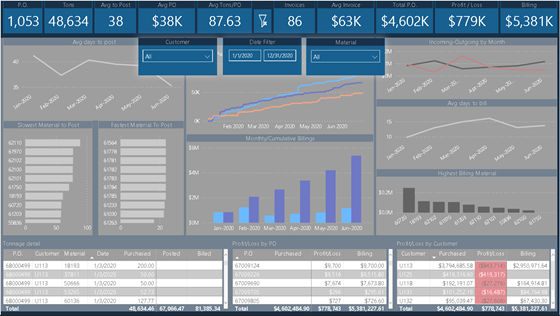
FILTERS

I implemented a pop-up filter to save screen real-estate. Straight-forward technique using bookmarks, selection pane and images. Here is the link to video https://www.youtube.com/watch?v=7OjY6bcyMg4. This can also be done with buttons, but I thought the images were a little easier to work.

NOTE: I noticed there were 3 large spikes in the billing would have skewed some of the charts, so I suppressed them in the model.
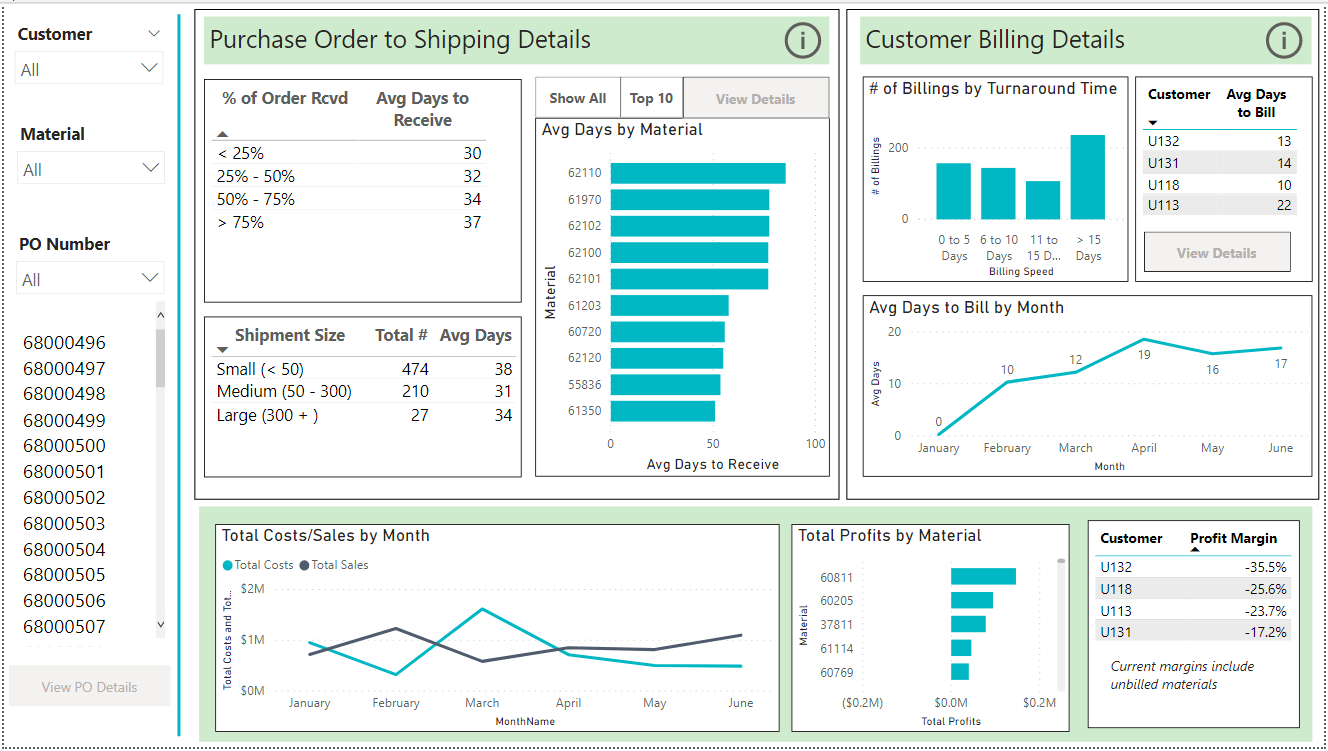
OBSERVATIONS

Other than unknown, all customers were in the red.

VERSION 2 - I’ll be re-visiting this after checking out some other examples of business processes - cash flow, supply chain, etc.

I just started with Power BI/Enterprise DBA and once I get all the plumbing complete I’ll get a link and upload the data source and PBIX. Looking forward to the next challenge

For the attached pbix, you will need to alter the source line in power query and

Happy visualizing.

Picture1

Picture2

Picture3

challenge71forum.pbix (259.3 KB)

Data Challenge 7(1).xlsx (196.7 KB)

5 Likes

@markperrone,

Wow! Quite a way to introduce yourself to the Challenges. I really love everything about this entry - the information you’ve chosen to focus on, the color theme and organization of the visuals, the use of the small tables at the bottom, and the slicer pop-out from the filter button at the top, among a lot of other things. Also interested to take a deeper look at your data modeling approach, since it’s unique among the entries to date.

Also, thanks for the detailed write up. This did jump out at me:

What is your background that you were able to do this after just starting with Power BI?

Thanks for participating – can’t wait to see what you do in Challenge #8 and beyond.

  • Brian

I worked with qlik for a few years at Ford and I’ve read several books by Edward Tufte and Stephen Few several times and never looked back. I’ve been learning power bi on my own now for a few months (Curbal, Enterprise DNA, SQL BI) but these challenges (5-7) have really honed my skills. Also, I’ve been programming for near 35 years so its pretty much in my blood. I also a deep background in art, music and other right brain ideas. BI is an ideal match.

FYI - the color scheme is from Enterprise DNA.

yes, looking forward to challenge 8. Do they take suggestions ?

3 Likes