Yes! Actual scenarios and real-world data are preferred. Contact @haroonali1000, who coordinates the challenges.
Totally agree with you re: Tufte - I’ve got all his books in my collection and have taken his seminar twice. Really like Few’s Makeover Monday book, and just heard an interview with Marco Russo where he said Few’s “Show Me the Numbers” is essential .
There are many free sites that can generate colours and I use a couple one to generate a range of shades off one base colour (able to get 2 - 25 different shades).
Another one I use is one where you can upload a picture and extract colours from the image, so useful for corporate images and alternate schemes, this generates five colours from the image but also allows a ‘shuffle’ function to capture another five colours from the image. https://icolorpalette.com/color-palette-from-
images
Hello Everyone,
Sorry for the late submission. I was busy for the last two weeks and I thought I should work on and submit Challenge 7 first before diving into Challenge 8.
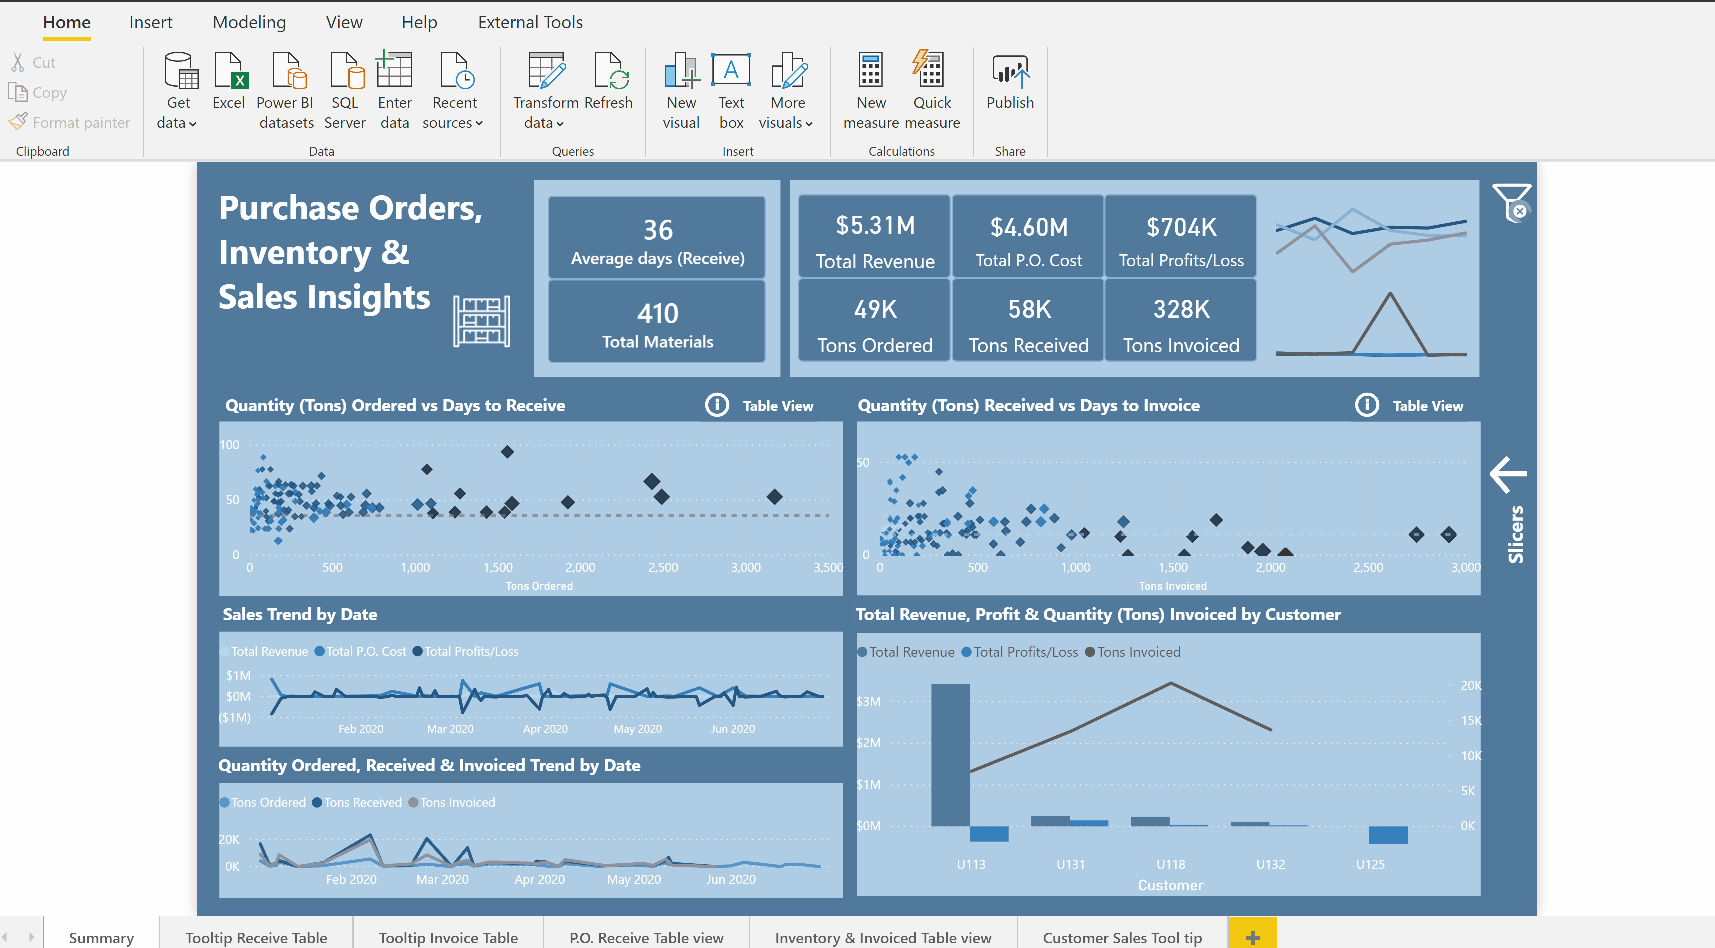
Data Model:-
The challenging part for me was creating a Data Model that is efficient, and it took me awhile to come up with one that works well for the requirement.
I created the following three dimension tables and fact tables in Power Query :-
There are four dimension tables created after extracting distinct values of the Purchase Orders, Materials, Customers and a new Date table.
In order to create some of the calculations needed for this report, the three tables provided were merged using a left join starting with the biggest table which is invoices table in Power Query.
Visualizations:-
I created the visuals on this report after learning from my fellow participants on how to create a tool tip visual and some other techniques.
So thanks every one for the continuous learning experience I am having and for your support.