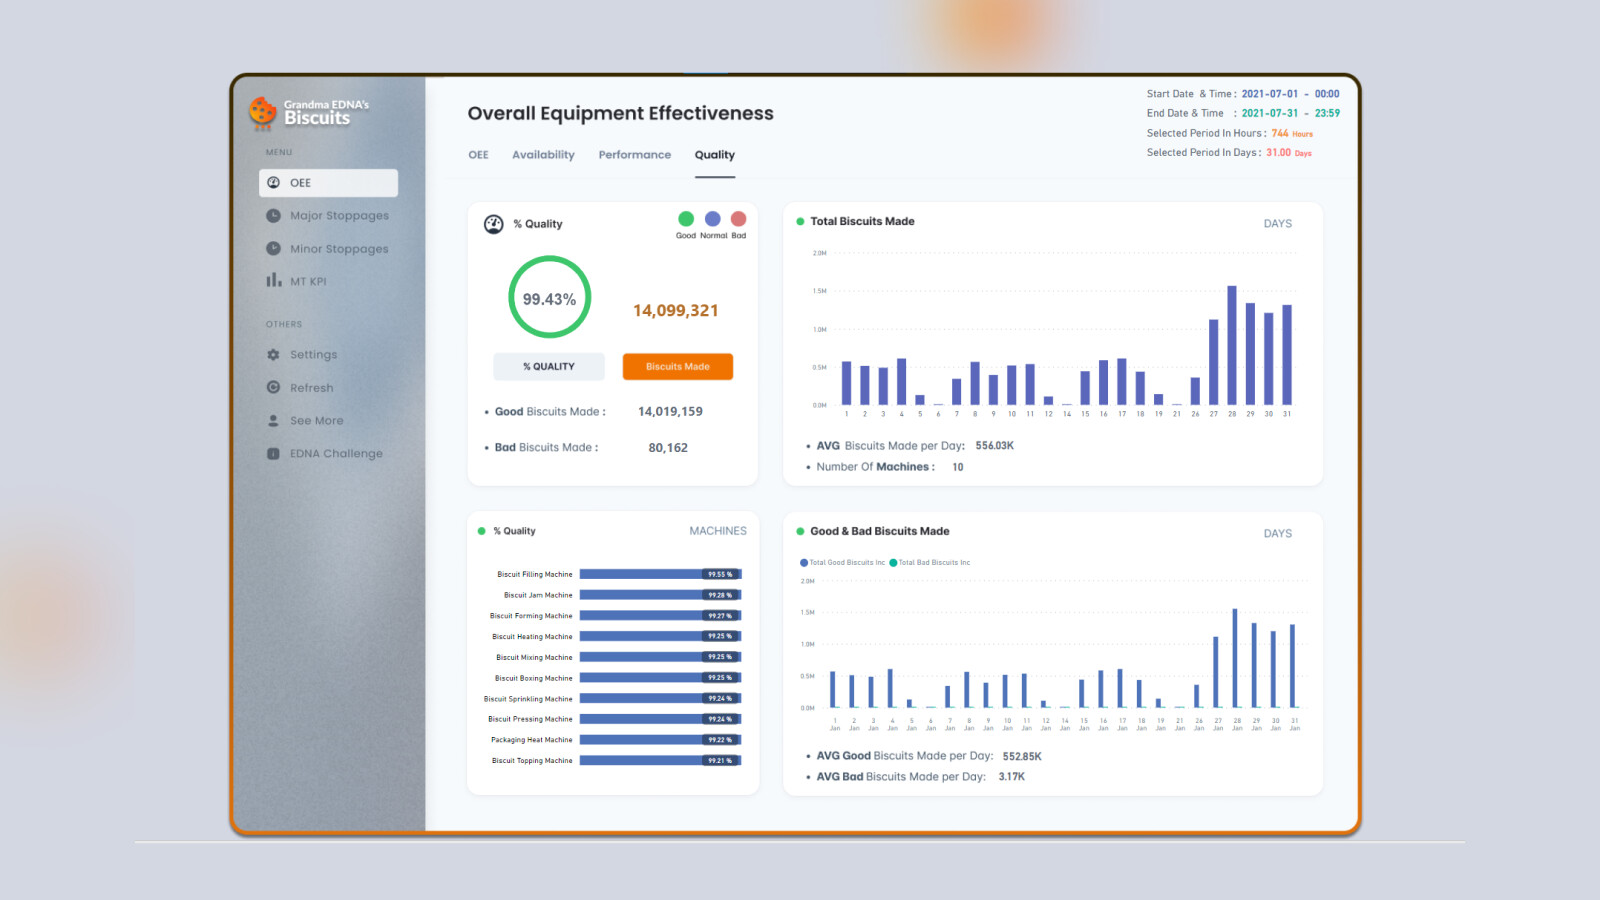
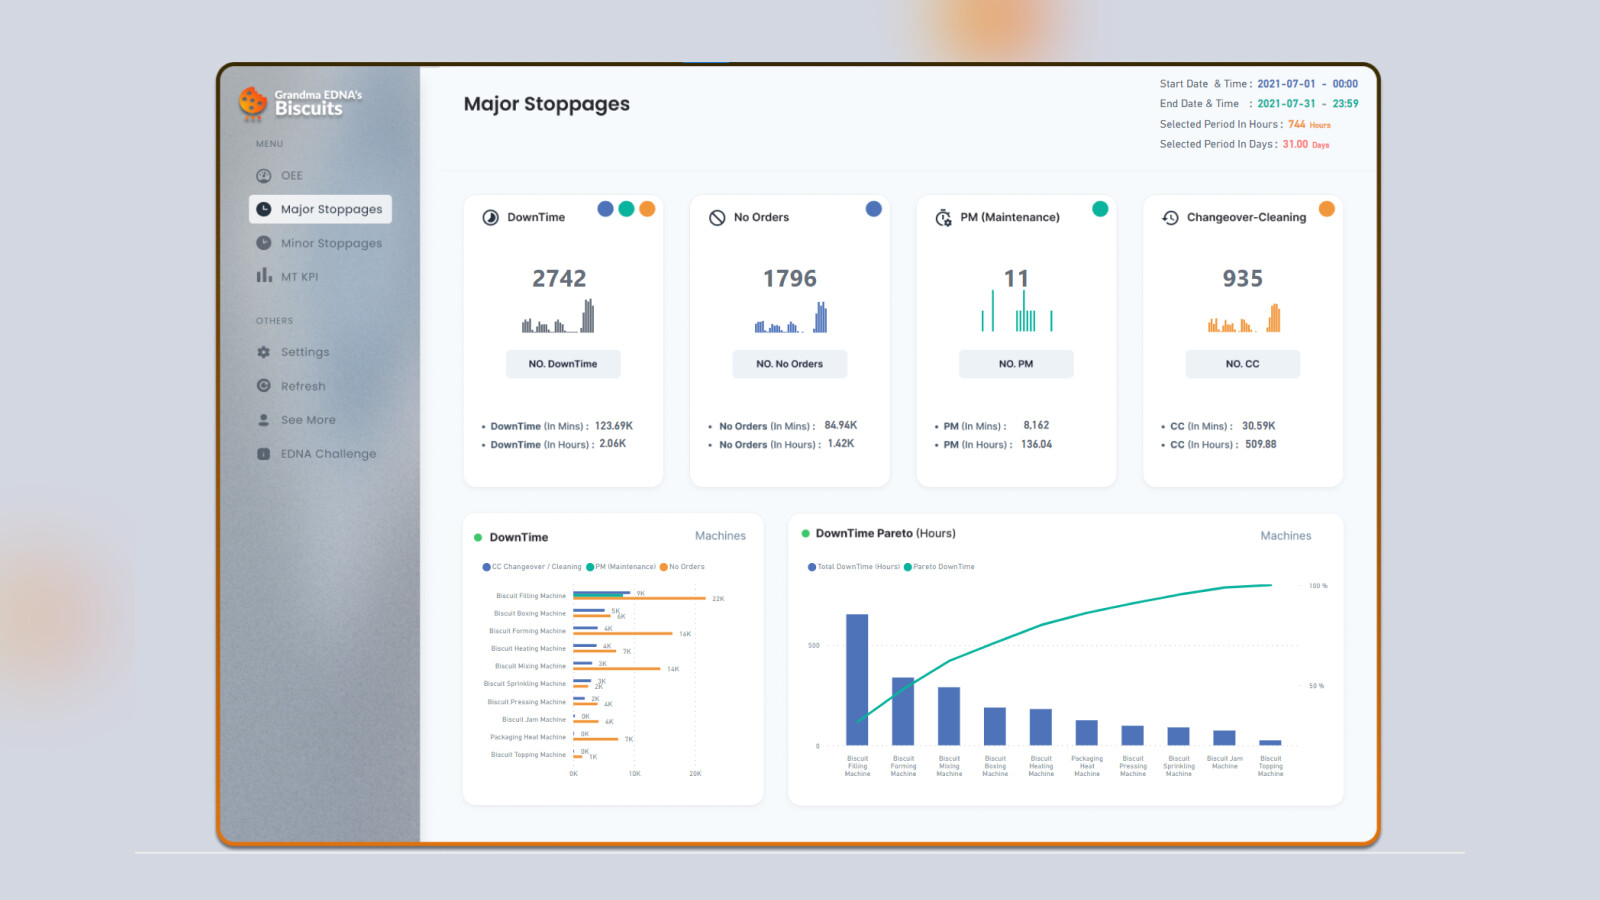
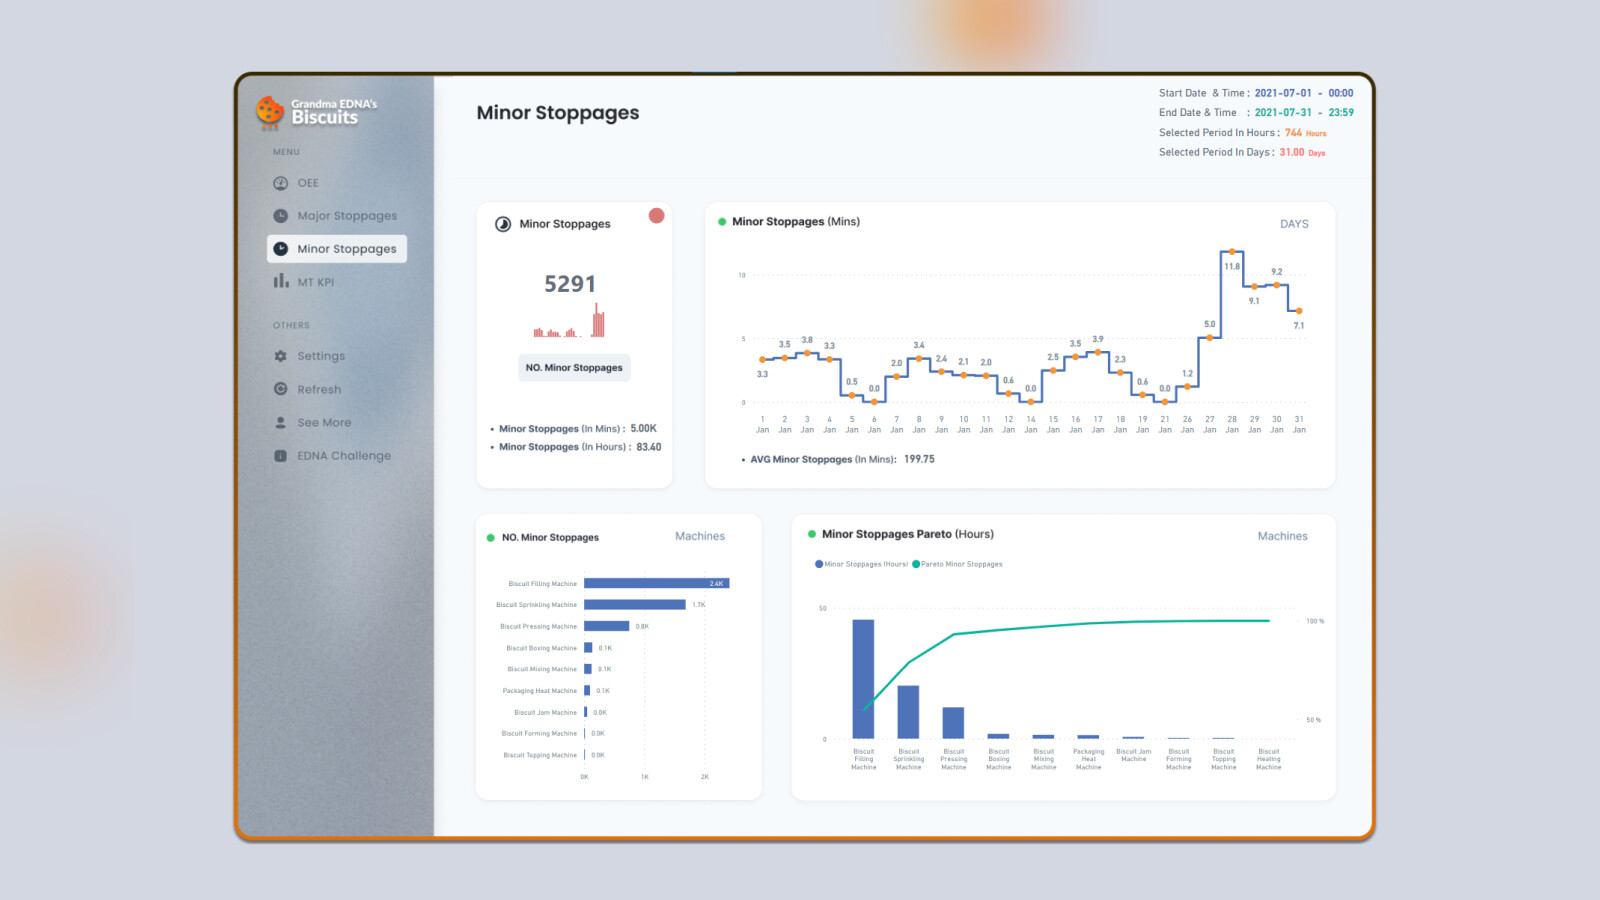
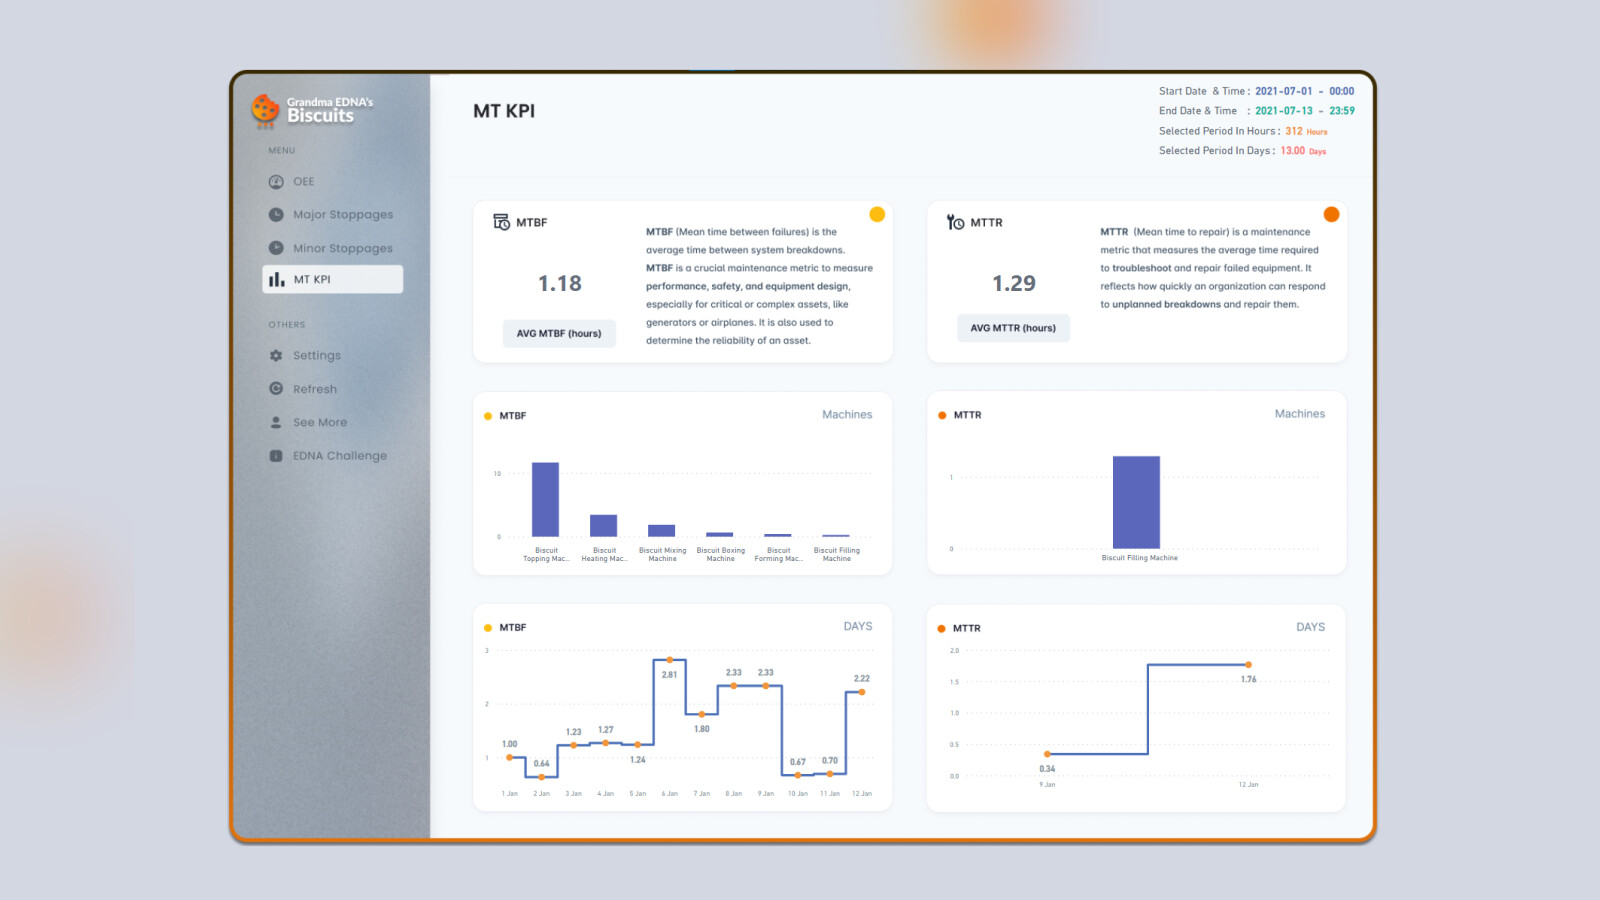
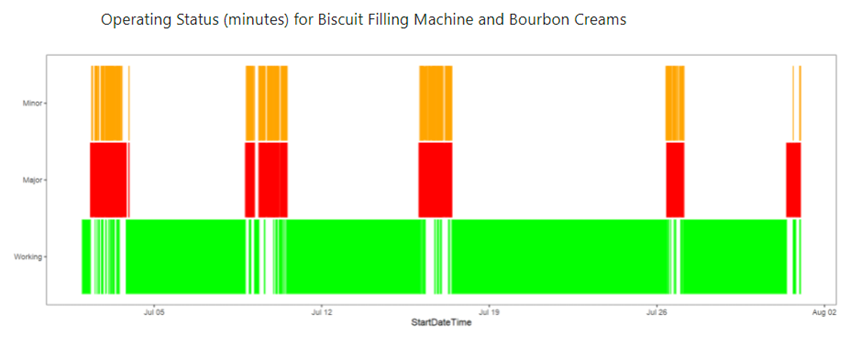
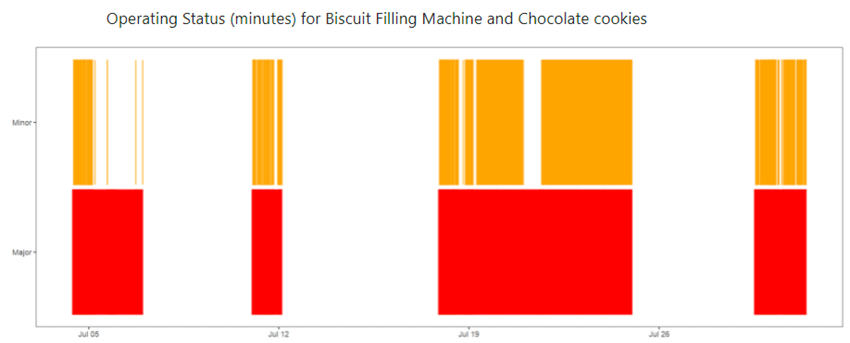
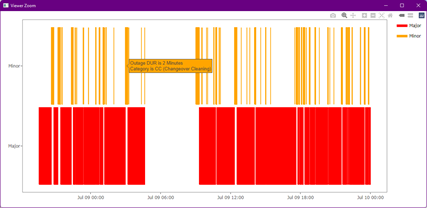
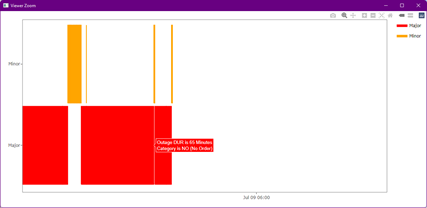
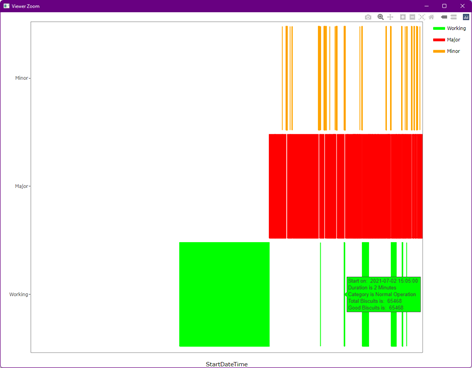
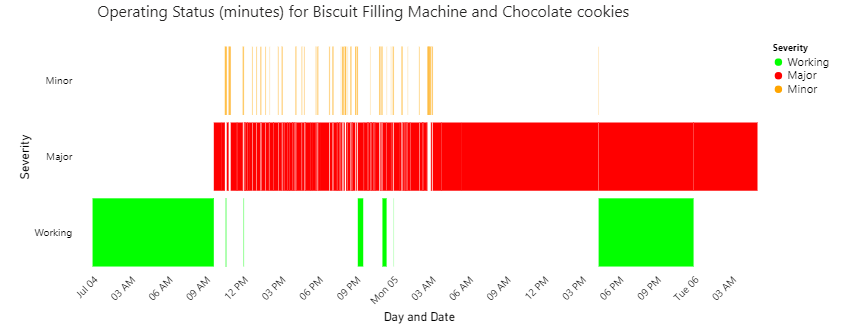
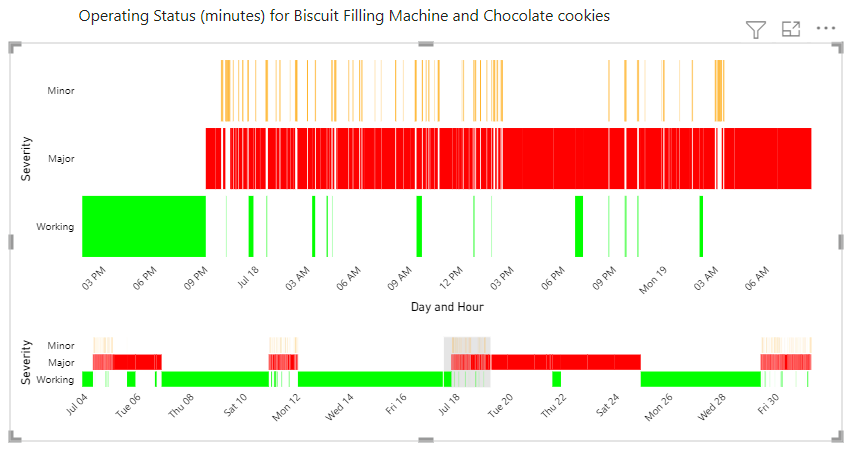
Updated with a new tab ‘try Deneb’ and now the visual supports zoom, pan and tooltips. This is much more useful as you can zoom into an interval and explore the outages, etc.
Use the mouse wheel to zoom in and pan around.
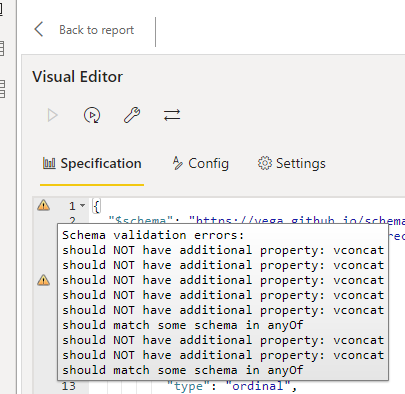
Started with the empty Deneb specification and built it up to:
{
  "$schema": "https://vega.github.io/schema/vega-lite/v5.json",
  "description": "An attempt at a chart recorder -like output",
  "data": {"name": "dataset"},
    "params": [{
    "name": "grid",
    "select": "interval",
    "bind": "scales"
  }],
  "mark": {
    "type": "bar"
  },
  "encoding": {
    "y": {
      "field": "Severity",
      "type": "ordinal",
	  "sort": ["Minor", "Major", "Working"]
    },
    "x": {
      "timeunit": "day",
      "field": "Start",
      "type": "temporal",
      "title": "Day and Hour",
      "axis": {
        "labelAngle": -45
        }
      },
    "x2": {
      "field": "End",
      "type": "temporal"
    },
    "color": {
      "field": "Severity",
      "type": "ordinal",
      "scale": {
        "domain": ["Working", "Major", "Minor"],
        "range": ["#00FF00", "#FF0000", "#FFA500"]
        }
      },
    "opacity": {
      "condition": {
        "test": {
          "field": "__selected__",
          "equal": "off"
        },
        "value": 0.3
      },
      "value": 1
    },
    "tooltip": [
      {"field": "Start", "type": "temporal", "timeUnit": "hoursminutes"},
      {"field": "Duration", "type": "quantitative"},
      {"field": "OEE Category", "type": "nominal"},
      {"field": "newTotalMade", "type": "nominal"},
      {"field": "newGood", "type": "nominal"}
      ]
  }
}
Likely a bit clumsy and need to rename some items, improve the tool tip, etc.
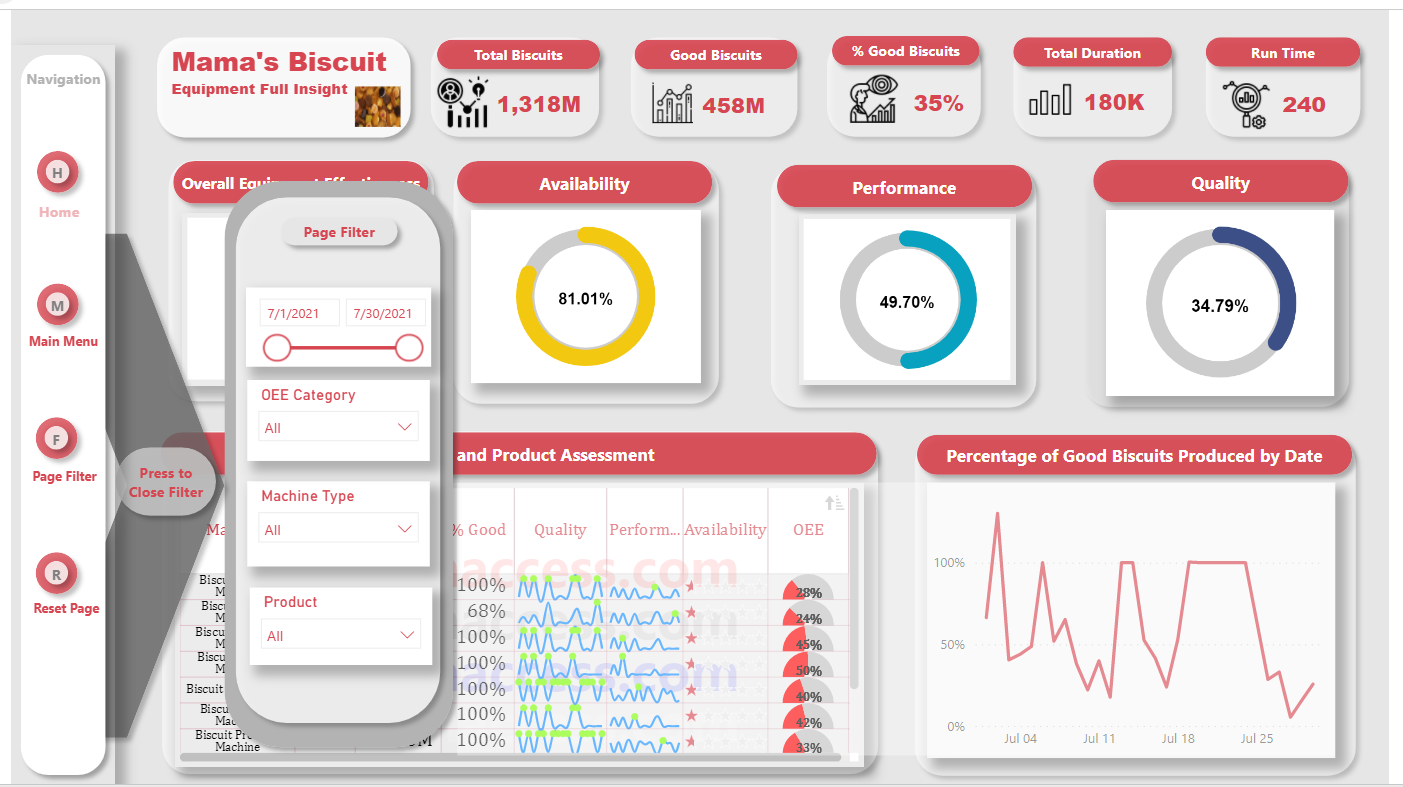
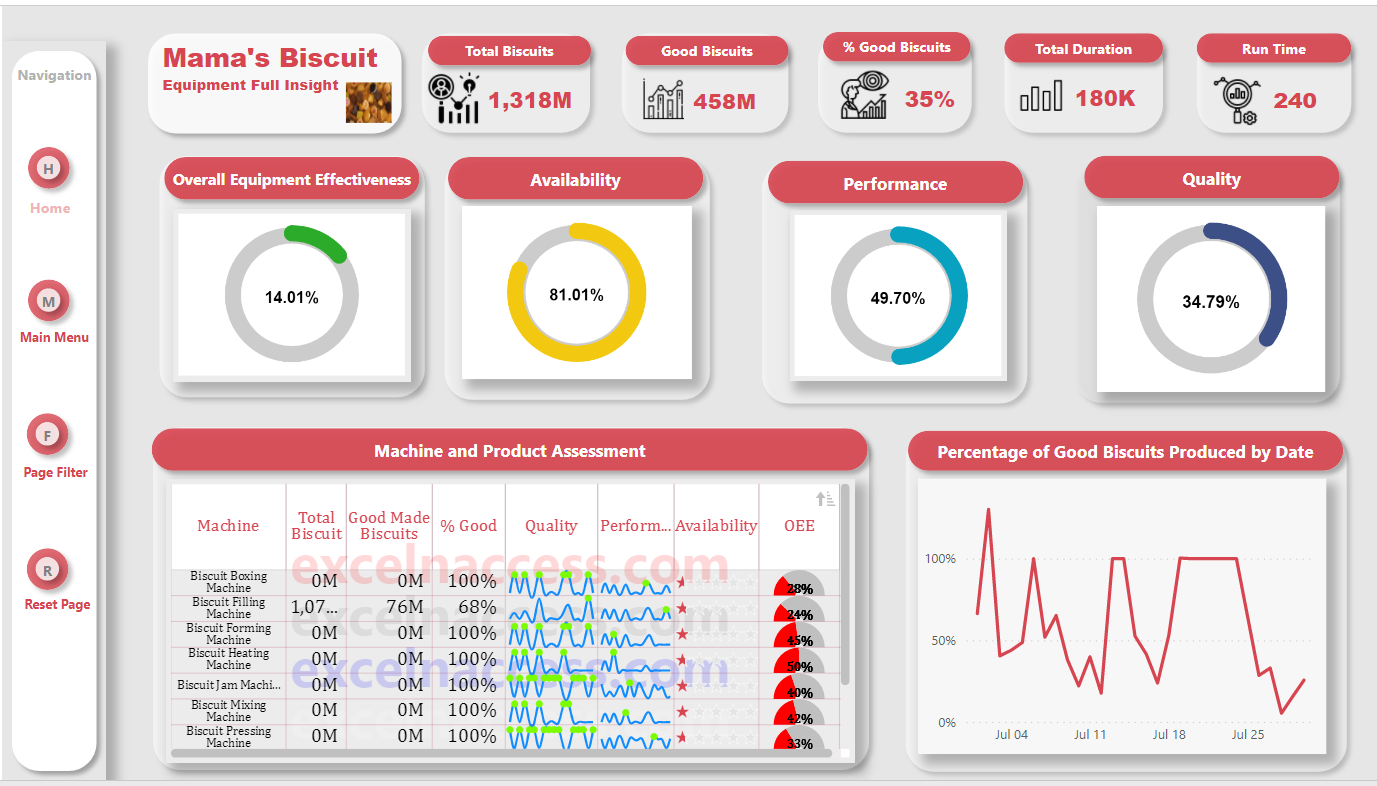
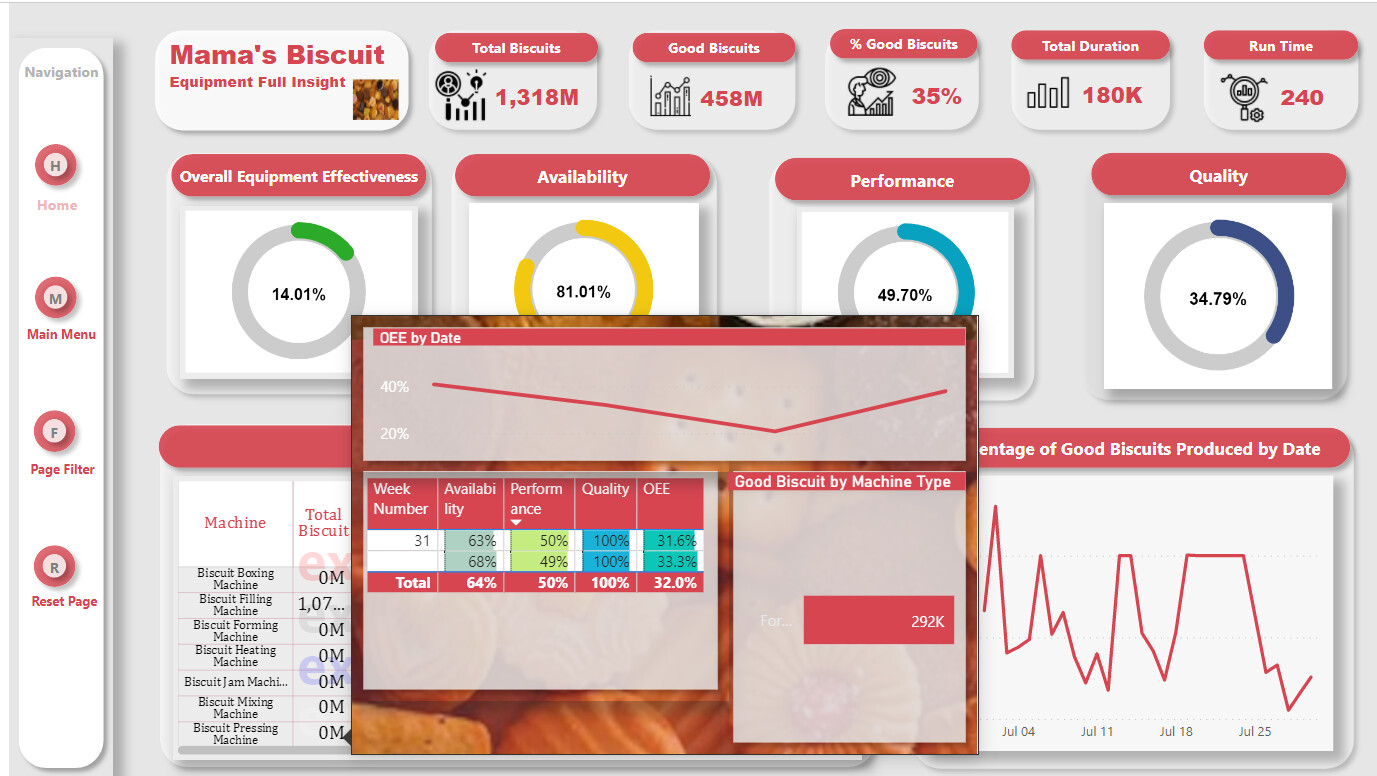
StripChart v2.pbix (2.1 MB)
Tim