Power BI Builds 18 - OEE Manufacturing Report

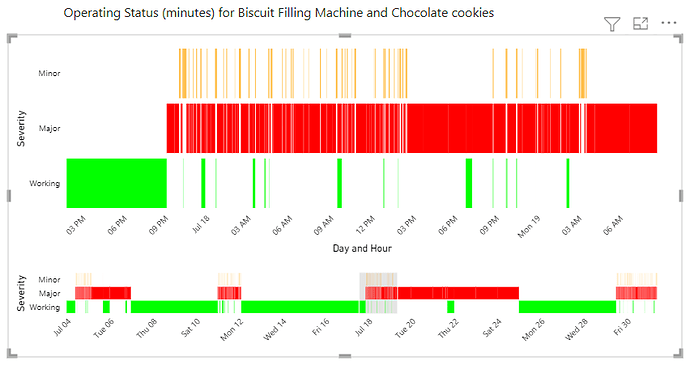
Updated with a new tab ‘try Deneb’ and now the visual supports zoom, pan and tooltips. This is much more useful as you can zoom into an interval and explore the outages, etc.


Use the mouse wheel to zoom in and pan around.

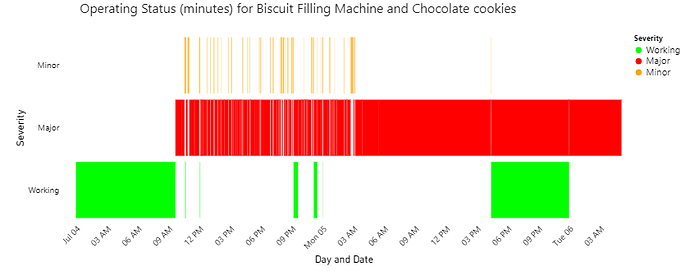
Started with the empty Deneb specification and built it up to:

{
  "$schema": "https://vega.github.io/schema/vega-lite/v5.json",	
  "description": "An attempt at a chart recorder -like output",
  "data": {"name": "dataset"},
    "params": [{
    "name": "grid",
    "select": "interval",
    "bind": "scales"
  }],
  "mark": {
    "type": "bar"
  },
  "encoding": {
    "y": {
      "field": "Severity",
      "type": "ordinal",
	  "sort": ["Minor", "Major", "Working"]
    },
    "x": {
      "timeunit": "day",
      "field": "Start",
      "type": "temporal",
      "title": "Day and Hour",
      "axis": {
        "labelAngle": -45
        }
      },
    "x2": {
      "field": "End",
      "type": "temporal"
    },
    "color": {
      "field": "Severity",
      "type": "ordinal",
      "scale": {
        "domain": ["Working", "Major", "Minor"],
        "range": ["#00FF00", "#FF0000", "#FFA500"]
        }
      },
    "opacity": {
      "condition": {
        "test": {
          "field": "__selected__",
          "equal": "off"
        },
        "value": 0.3
      },
      "value": 1
    },
    "tooltip": [
      {"field": "Start", "type": "temporal", "timeUnit": "hoursminutes"},
      {"field": "Duration", "type": "quantitative"},
      {"field": "OEE Category", "type": "nominal"},
      {"field": "newTotalMade", "type": "nominal"},
      {"field": "newGood", "type": "nominal"}
      ]
  }
}

Likely a bit clumsy and need to rename some items, improve the tool tip, etc.
StripChart v2.pbix (2.1 MB)

Tim
Another way to pan and zoom is shown below. Select a region on the lower visual to highlight in the visual above - where tooltips provide additional detail on production and outages.

Tim
StripChart v2b.pbix (2.1 MB)

Tim, great idea to display the stoppage data on a strip chart!
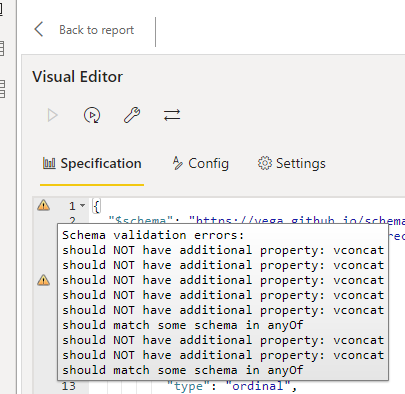
I noticed in your deneb visual the following json validation issue. Are these showing in your visual as well?
image

Thanks, Daran and yes I have all those errors. Likely an artifact of pasting a bunch of code fragments together - and I did not look a lot at the Config section - where I likely need to delete things I override in the specification.

I like this Deneb stuff - but have a lot to learn.

tim

1 Like

Playing with this a bit more, the schema validation errors appears when I add the “x2” definition for the end of the bar. Using the GANTT example the error appears when I define the x axis as temporal. It may be that I need to use a DUR to define the bar size (instead of start and end time)

I added these two examples to the example template tab.
StripChart v2c.pbix (2.1 MB)

1 Like
1 Like

Congratulations @Paul.Gerber

4 Likes

Very nice report!
@EnterpriseDNA @Rachwen_Mesbehi entry zip file on the showcase is missing the pbix file:
OEE Data Report | Enterprise DNA

Please add the pbix file so we can all learn from this great report!
Thanks

Hello @Paul.Gerber @haroonali1000 Please share the pbix file to konw more about dashboard. Thanks in advance and please consider it on urgent basis

Hi @V_Baisla,

Welcome to the forum.

More about data and requirements you can find at the brief.

If you are look for some showcases - you can find at : https://app.enterprisedna.co/app/showcase

Hope it helps.

1 Like

Hi @V_Baisla people on this forum, by in large, volunteer in their free time so please don’t put time pressures on contributors, it is against the ethos of the forum.

1 Like