Yeah, I think the randomizing of the data is affecting what seems logical.
For example, can 496 boxes of milk cookies be produced in 28 secs?
1 Like
I could eat 496 boxes in 28 secs 

3 Likes
Me too … back in university I was on the swim team and could eat like a horse (12K+ calories per day) … we used to stop at the donut shop on the way home from morning practice and eat a dozen donuts before having breakfast … ahh, memories …
Greg
2 Likes
Ah, the ability to eat whatever you want without consequence to your waistline…a distant memory!
2 Likes
Hi All,
Just a quick note on some of the questions being asked:
You can assume there are multiple lines in operation and the products are being made on separate manufacturing lines.
As for the values being small and the utilisation seeming very miniscule this is due to the data randomisation I appreciate this will cause some exaggerated figures and some odd looking results but as long as you are consistent with units please feel free to interpret as you see best.
Thanks,
H
4 Likes
A couple of questions that I have been meaning to ask for some time now and have instead been following the posts and responses to get a more comprehensive understanding of the data. There are some questions that I haven’t seen and wanted to address them.
-
From what I can see (and what I would imagine) not every product requires the same machines to produce the final product.
For examples:
The Almond Biscotti, Caramel Swirls, Chocolate Digestives, Coco Rings, Deluxe Cookies, Digestives, Fruit and Nut, Hazelnut Wafers, Orange Creams, Party Rings, Peanut Cookies and Vienesse Creams only have data for the Jam, Press and Sprinkling machines. Based on that it would lead me to believe these products are all still WIP, and no products have been produced because all the products should be packaged and cased (boxed) to prepare them for sale.
The Pink Wafers only utilize the Forming, Filling and Boxing machines, and skips the packaging machine, so again, no products would be ready for sale. Do we just want to focus on each machine separately, and tally the counts? I might be over complicating the analysis by looking at WIP and finished product. -
Ignoring the previously stated question regarding production lines and machine stages, WIP etc, I’m trying to get a little more insight into what completed biscuits represents. In looking at the Almond Biscotti the pressing machine produces 21,851 good biscuits and 1 total biscuit from 5:53 AM 29/7 until 9:07 PM. From 6:05 AM until 6:41 PM 2109 good biscuits get processed at the Jam Machine. From 7:00 AM until 7 PM 27,354 good biscuits go through the Sprinkling Machine.
Based on a production line, I wonder how you can start with 21K biscuits, only process 2K through the second machine phase and end up with 27K biscuits. -
I’m having a hard time understanding the data for a couple other reasons. The total biscuits tally is supposed to be a representation of total produced. In previous threads it mentions that the total biscuits counter doesn’t work all the time and to assume a 0% waste rate when the total is missing. This is a cumulative figure, so how does the cumulative figure drop from 109,350 biscuits at 12:34 PM down to 22,886 biscuits on the sprinkling machine?
-
I want to keep this short but detailed as my question is coming in later in the game. I don’t understand how the start times, end times and duration work. Going back to the Almond Biscotti again.
a) If the Pressing machine stops running from 8:45 AM to 8:48 AM for 3 minutes for CC, then stops again from 8:48 AM until 8:49 AM and then stops from 8:49 AM until 8:52 for no orders, I imagine that from 8:45 AM until 8:52 AM the machine had back-to-back stoppages, however 339 good biscuits are produced. If you factor that out across the entire day, the pressing machine was stopped for a total of 667.82 minutes during a run-time of 667.90 minutes but produced 21K biscuits. Am I interpretating the data incorrectly?
b) If there is a dedicated machine for each product, why is there so much changeover cleanings, some only 3 minutes apart. I would assume a machine only goes into CC mode when it must create a different type of biscuit or for periodic cleaning, maybe a couple times a day. This probably leads back to my question about the start and end times.
2 Likes
Hello everyone,
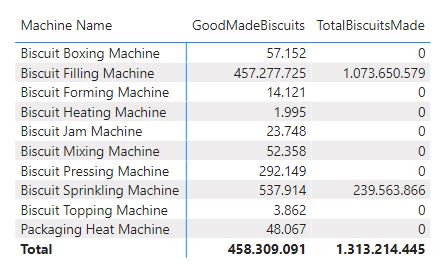
I know this is randomized data, but I am getting some weird results. When I compare total biscuits made and good biscuits it seems that total columns contains only data for two machines and even that number makes no sense. Has anyone else had some similar result?
@Milos Didn’t Haroon’s previous post clear up this point?
2 Likes
Oh,
I am sorry, didn’t see that. Thanks!
1 Like
Hey @darandavis
How are you approaching this scenario where we know thatTotalBiscuitsMade is a column with a cumulative total. and according to the update, in the case where GoodMadeBiscuits made are more than total biscuits made, we are assuming that total biscuits made were same as Good biscuits(100% quality)
Now when we are updating the column of Total biscuits, are we taking the previous value and adding up the Total Biscuits(i.e. good biscuits), to give it a continuity as a cumulative column?
so just to make it clear,
| Index | Machine Name | Good Biscuits | Total biscuits (Cumulative total at beginning of stoppage) | |
|---|---|---|---|---|
| 1 | Biscuit Filling Machine | 500 | 1000 | |
| 2 | Biscuit Filling Machine | 250 | 0 | (Should this be 1000 + 250) |
|  |
I’ve been working to get this but have been failing miserably 
1 Like
IF Good Biscuits are a percentage of the cum total of biscuits THEN when correcting the Total to match the Good when total < good there is no need for any additional calculation.
tim
2 Likes
Ooh. I guess u was interpreting the Goodbiscuits column in the wrong way.
I get it now.
Thanks
1 Like
Hi all,
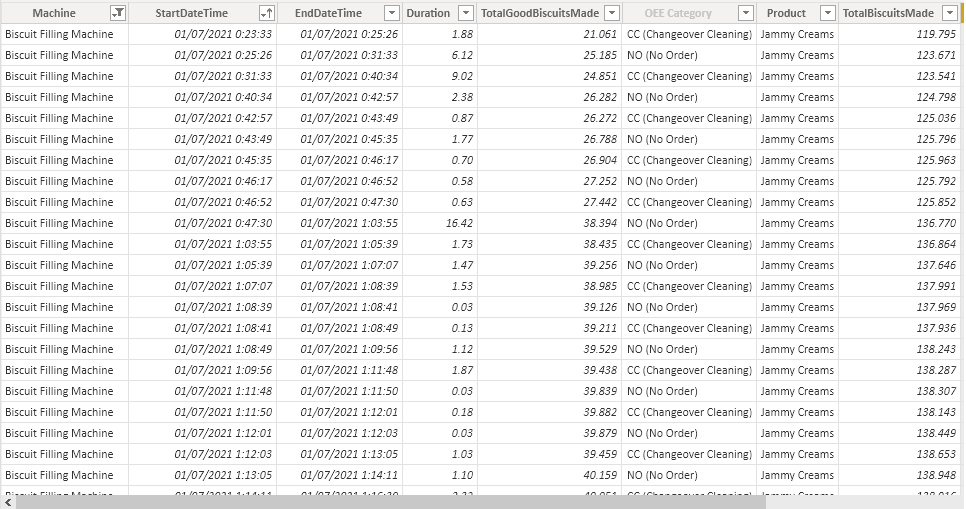
Analyzing the data from the stops of the machines, the same thing happens to me as to ibesmond, for the Biscuit Filling Machine, on 07/01/2021 the stop time of each record is equal to the start time of the following record while that the cookies made is increasing.
Regarding the effective times per machine, for this machine, on 07/01/2021 it has 24 hours available minus the downtimes and gives me a result of 0.38 hours. This machine has produced two products in 24 hours a day, Jammy Creams and Custard Cream with stop times for each product. To calculate the effective time per machine and product, would we have to know the production time that each machine has been producing each product? It cannot be 24 hours except for the stoppage of that machine and product.
Thanks a lot
2 Likes
I interpreted the following from the brief to mean both total and good biscuits made are cumulative:
“For each stoppage the cumulative number of biscuits produced is also recorded along with the good biscuits allowing us to deduce waste.”
Since they are the same context then each stoppage row will give you a %waste without having to consider previous rows.
Additionally, the clarification below allows us to know waste for that type of stoppage:
“Wherever the good biscuits total exceeds the total biscuits made you should ignore the Total Biscuit count and use the Good made biscuits count i.e. quality will be 100%”
2 Likes
Regarding the products and lines, see the note from Haroon previously (44 in the thread)
tim
1 Like
Yeah - that’s where i was getting tripped, - I was interpreting total biscuits as cumulative, and good biscuits as just total.
I got it now.
Thanks.
2 Likes
Hi Tim,
Do you mean that for each Machine,Product pair for which there are records in the table of stops, there are 24 hours of gross time per day?
Thanks a lot.
1 Like
That is how I interpreted the data. IF a separate production line for each PRODUCT than each MACHINE is dedicated to that product, so 24 hours of Available Gross hours.
2 Likes
Hi I am somewhat new to using Power BI. I have been on Enterprise DNA for about 6 month. I am accountant who doesn’t use Power BI for work but I want to develop this skill more so I am trying to do this challenge so that I can gain some practical experience.
I having been struggling with the numbers making sense but they may not make logical sense because from the above comments stating that the data it is random. This helps a little.
My main question is regarding using calculate. I have a measure that sums up all of duration hours but I can not seem how to ensure this duration hours always keeps the week ending into context no matter if I am looking at machine, products or another category. See below screen shot.
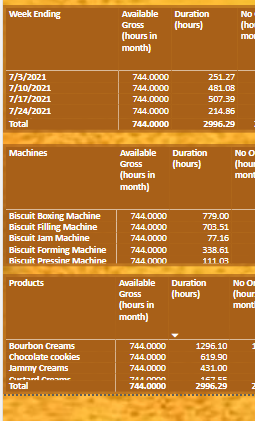
Any help would be appreciated.
Thanks.
David
1 Like
@DavidHalliday Hello and welcome! I ran into the same thing. Try using COUNT instead of SUM.
1 Like