All,
Power BI Accelerator Week #3 Is Live!
OK, I think we might be on to something here. Great participation again in Week #2, and I also noticed a number of Accelerator participants jumping into the Enterprise DNA Data Challenge for the first time, which is awesome. So, some great synergy between these initiatives.
Now, on to Week #3. Each week of Accelerator focuses on a particular theme fundamental to developing a well-rounded understanding of Power BI. In Week #1, we generally explored the power of context. In Week #2, we discussed how to construct a proper data model. This week, we return to the topic of context, focused on how to change context in DAX using CALCULATE, with a particular focus on the use of ALL, ALLSELECTED, ALLEXCEPT and REMOVEFILTERS. These functions, are the fundamental building blocks that make DAX so powerful.
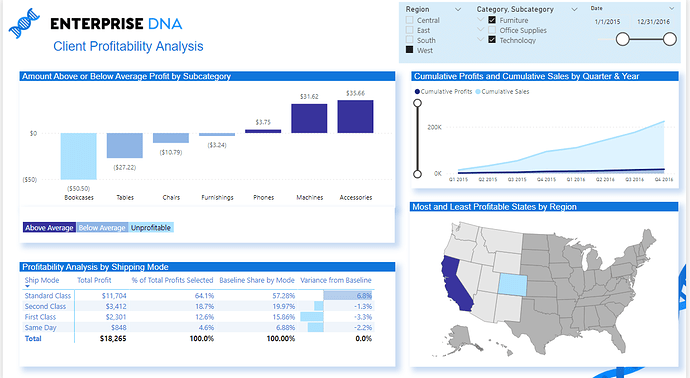
The scenario this week is to continue our engagement with the office supply superstore client, building the following report that does a deep dive analysis on the profitability of their business. Even using just the concepts we have covered in weeks #1 and #2, plus what we will cover this week we are able to generate a report that personally I would be pleased to provide to a client or my managers – showing once again that you do not need to be an expert in Power BI in order to generate reports that provide tremendous insight and value.
That being said, this is not an easy challenge. For most of us, these concepts take a while and some repeated practice before they fully “click”. The report is composed of four separate sub- analyses. The cumulative analysis at the top right is pretty straightforward, but they get progressively more difficult as you move counterclockwise. Even if you don’t get all four on the first try, that’s fine – give them your best shot and I guarantee whether you get to the full solution are not, the effort will result in a lot of learning and will make the solution session that much more meaningful.
A few points to note:
- I have modified the dataset from Week #2 slightly to remove the records associated with copier sales. The profits on this particular subcategory were so high they were distorting the results in every other area. If you use your Week #2 data model rather than the one I provide below, just be sure to remove these records from your model as well.
- Since we haven’t covered variables yet, my solution does not use them. However, if you feel comfortable using them, by all means do so – it will substantially reduce the number of measures you need to write.
- The attached PBIX contains additional instructions, as well as reference materials if you run into trouble with any of the key concepts needed to complete this exercise. You can also always post questions on the forum in this thread (just be sure to use the spoiler blur to prevent others from seeing information they may not want to).
We will be doing our live solution event on Wednesday, August 11 at 5 PM EDT. Registration link to follow shortly.
Enjoy, and thanks for participating! Hope to see you next week at the solution session.
• Brian
P.S. Enormous thanks to Accelerator Advisory Team members @KimC and @m.eric for their outstanding input on this week’s problem.
EDNA Power BI Accelerator – Week 3 Problem Final.pbix (9.7 MB)


